MetLife 2001 Annual Report Download - page 60
Download and view the complete annual report
Please find page 60 of the 2001 MetLife annual report below. You can navigate through the pages in the report by either clicking on the pages listed below, or by using the keyword search tool below to find specific information within the annual report.-
 1
1 -
2
-
3
-
4
-
5
-
6
-
7
-
8
-
9
-
10
-
11
-
12
-
13
-
14
-
15
-
16
-
17
-
18
-
19
-
20
-
21
-
22
-
23
-
24
-
25
-
26
-
27
-
28
-
29
-
30
-
31
-
32
-
33
-
34
-
35
-
36
-
37
-
38
-
39
-
40
-
41
-
42
-
43
-
44
-
45
-
46
-
47
-
48
-
49
-
 50
50 -
 51
51 -
 52
52 -
 53
53 -
 54
54 -
 55
55 -
 56
56 -
 57
57 -
 58
58 -
 59
59 -
 60
60 -
 61
61 -
 62
62 -
 63
63 -
 64
64 -
 65
65 -
 66
66 -
 67
67 -
 68
68 -
 69
69 -
 70
70 -
71
-
72
-
73
-
74
-
75
-
76
-
77
-
78
-
79
-
80
-
81
 |
 |

METLIFE, INC.
NOTES TO CONSOLIDATED FINANCIAL STATEMENTS — (Continued)
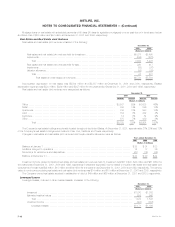
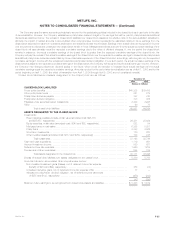
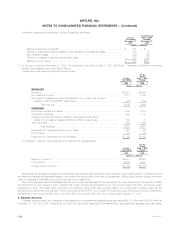
The following is a reconciliation of the notional amounts by derivative type and strategy at December 31, 2001 and 2000:
December 31, 2000 Terminations/ December 31, 2001
Notional Amount Additions Maturities Notional Amount
(Dollars in millions)
BY DERIVATIVE TYPE
Financial futures**************************************************** $ 254 $ 507 $ 761 $ —
Financial forwards ************************************************** — 529 462 67
Interest rate swaps ************************************************* 1,450 1,165 766 1,849
Floors ************************************************************ 325 — — 325
Caps************************************************************* 9,950 150 2,210 7,890
Foreign currency swaps ********************************************* 1,449 660 184 1,925
Exchange traded options ******************************************** 9 1,861 13 1,857
Written covered call options****************************************** 40 1,097 1,097 40
Credit default swaps************************************************ — 270 — 270
Total contractual commitments *************************************** $13,477 $6,239 $5,493 $14,223
BY STRATEGY
Liability hedging **************************************************** $11,616 $ 269 $2,972 $ 8,913
Invested asset hedging********************************************** 1,607 5,081 1,378 5,310
Portfolio hedging *************************************************** 254 507 761 —
Anticipated transaction hedging*************************************** — 382 382 —
Total contractual commitments *************************************** $13,477 $6,239 $5,493 $14,223
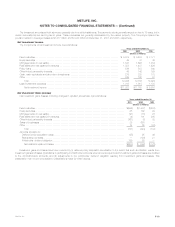
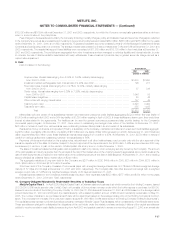
The following table presents the notional amounts of derivative financial instruments by maturity at December 31, 2001:
Remaining Life
After One After Five
One Year Year Through Years Through After
or Less Five Years Ten Years Ten Years Total
(Dollars in millions)
Forward exchange contracts******************************************* $67 $— $ — $— $ 67
Interest rate swaps*************************************************** 95 627 955 172 1,849
Floors************************************************************** — — 325 — 325
Caps ************************************************************** 3,720 4,150 20 — 7,890
Foreign currency swaps ********************************************** 81 863 707 274 1,925
Exchange traded options ********************************************* 1,857 — — — 1,857
Written covered call options ******************************************* 40 — — — 40
Credit default swaps ************************************************* 15 255 — — 270
Total contractual commitments ***************************************** $5,875 $5,895 $2,007 $446 $14,223
The following table presents the notional amounts and fair values of derivatives by type of hedge designation at December 31, 2001 and 2000:
2001 2000
Current Market Current Market
or Fair Value or Fair Value
Notional Notional
Amount Assets Liabilities Amount Assets Liabilities
(Dollars in millions)
BY TYPE OF HEDGE
Fair Value************************************************************ $ 228 $ 23 $— $ 212 $ 14 $ 8
Cash Flow *********************************************************** 585 62 21 442 32 27
Not designated ******************************************************* 13,410 202 26 12,823 136 10
Total ************************************************************ $14,223 $287 $47 $13,477 $182 $45
For the year ended December 31, 2001, the amount related to fair value and cash flow hedge ineffectiveness was insignificant and there were no
discontinued fair value or cash flow hedges.
For the years ended December 31, 2001, 2000 and 1999, the Company recognized net investment income of $32 million, $13 million and
$0.3 million, respectively, from the periodic settlement of interest rate and foreign currency swaps.
For the year ended December 31, 2001, the Company recognized other comprehensive income of $39 million relating to the effective portion of
cash flow hedges. At December 31, 2001, the accumulated amount in other comprehensive income relating to cash flow hedges was $71 million.
During the year ended December 31, 2001, $19 million of other comprehensive income was reclassified into net investment income primarily due to the
SFAS No. 133 transition adjustment. During the next year, other comprehensive income of $17 million related to cash flow hedges is expected to be
reclassified into net investment income. The reclassifications are recognized over the life of the hedged item.
MetLife, Inc. F-21