MetLife 2001 Annual Report Download - page 22
Download and view the complete annual report
Please find page 22 of the 2001 MetLife annual report below. You can navigate through the pages in the report by either clicking on the pages listed below, or by using the keyword search tool below to find specific information within the annual report.-
 1
1 -
2
-
3
-
4
-
5
-
6
-
7
-
8
-
9
-
10
-
11
-
 12
12 -
 13
13 -
 14
14 -
 15
15 -
 16
16 -
 17
17 -
 18
18 -
 19
19 -
 20
20 -
 21
21 -
 22
22 -
 23
23 -
 24
24 -
 25
25 -
 26
26 -
 27
27 -
 28
28 -
 29
29 -
 30
30 -
 31
31 -
 32
32 -
33
-
34
-
35
-
36
-
37
-
38
-
39
-
40
-
41
-
42
-
43
-
44
-
45
-
46
-
47
-
48
-
49
-
50
-
51
-
52
-
53
-
54
-
55
-
56
-
57
-
58
-
59
-
60
-
61
-
62
-
63
-
64
-
65
-
66
-
67
-
68
-
69
-
70
-
71
-
72
-
73
-
74
-
75
-
76
-
77
-
78
-
79
-
80
-
81
 |
 |

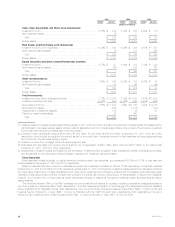
from $163 million in 1999, primarily due to the increased volume of this book of business and increased catastrophe experience as discussed above.
The homeowners loss ratio increased by 1.6% to 66.0% in 2000 from 64.4% in 1999. Other personal lines benefits and claims decreased by $1 million
to $11 million in 2000 from $12 million in 1999.
Other expenses increased by $313 million, or 61%, to $827 million in 2000 from $514 million in 1999, which resulted in an increase in the expense
ratio to 31.4% in 2000 from 29.3% in 1999. A portion of the increase in expenses from 1999 to 2000 is associated with the costs incurred in connection
with the integration of the St. Paul business acquired.
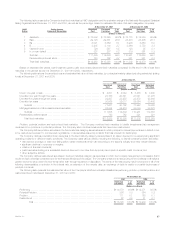
Asset Management
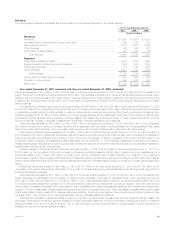
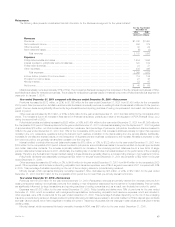
The following table presents consolidated financial information for the Asset Management segment for the years presented:
For the Year Ended
December 31,
2001 2000 1999
(Dollars in millions)
Revenues
Net investment income ******************************************************************** $71 $90 $80
Other revenues ************************************************************************** 198 760 803
Net investment gains ********************************************************************* 25 — —
Total revenues *********************************************************************** 294 850 883
Other Expenses ************************************************************************ 252 749 741
Income before provision for income taxes and minority interest*********************************** 42 101 142
Provision for income taxes ***************************************************************** 15 32 37
Minority interest ************************************************************************** —3554
Net income ***************************************************************************** $27 $34 $51
Year ended December 31, 2001 compared with the year ended December 31, 2000—Asset Management
Other revenues, which are primarily comprised of management and advisory fees from third parties, decreased by $562 million, or 74%, to
$198 million in 2001 from $760 million in 2000. The most significant factors contributing to this decline were a $522 million decrease resulting from the
sale of Nvest, which occurred on October 30, 2000, and a $48 million decrease resulting from the sale of Conning, which occurred on July 2, 2001.
Excluding the impact of these transactions, other revenues increased by $8 million, or 5%, to $167 million in 2001 from $159 million in 2000. This is
attributable to an increase in real estate assets under management that command a higher fee. Assets under management in the remaining Asset
Management organization decreased from $56 billion as of December 31, 2000 to $51 billion at December 31, 2001. The decline occurred as a result of
the equity market downturn and MetLife institutional customer withdrawals. Third party assets under management registered only a slight decrease of
$352 million as a result of the equity market downturn, substantially offset by strong mutual fund sales and the purchase of a real estate portfolio in the
second quarter of 2001 comprised of new assets of $1.7 billion. Management and advisory fees are typically calculated based on a percentage of
assets under management, and are not necessarily proportionate to average assets managed due to changes in account mix.
Other expenses decreased by $497 million, or 66%, to $252 million in 2001 from $749 million in 2000. The sale of Nvest reduced other expenses
by $457 million and the sale of Conning reduced other expenses by $55 million. Excluding the impact of these transactions, other expenses increased
by $15 million, or 7%, to $217 million in 2001 from $202 million in 2000. This variance is attributable to an increase in total compensation and benefits
and an increase in discretionary spending. Compensation and benefits expense totaled $111 million in 2001 and is comprised of approximately 63%
base compensation and 37% variable compensation. Base compensation increased by $9 million, or 15%, to $70 million in 2001 from $61 million in
2000, primarily due to higher staffing levels. Variable compensation decreased by $1 million, or 2%, to $41 million in 2001 from $42 million in 2000 due to
lower profitability. Variable incentive payments are based upon profitability, investment portfolio performance, new business sales and growth in revenues
and profits. The variable compensation plans reward the employees for growth in their businesses, but also require them to share in the impact of any
declines. Increased sales commissions arising from higher mutual fund sales in 2001 were largely offset by downward revisions in other variable
compensation due to a decline in profits. Other general and administrative expenses increased $7 million, or 7%, to $106 million in 2001 from $99 million
in 2000, primarily due to increases in occupancy costs and increased mutual fund reimbursement subsidies.
Minority interest, principally reflecting third-party ownership interest in Nvest, decreased by $35 million, or 100%, due to the sale of Nvest.
Year ended December 31, 2000 compared with the year ended December 31, 1999—Asset Management
Other revenues, which are primarily comprised of management and advisory fees, decreased by $43 million, or 5%, to $760 million in 2000 from
$803 million in 1999. The most significant factor contributing to this decline is a $131 million decrease resulting primarily from the sale of Nvest, which
occurred on October 30, 2000. This reduction is partially offset by a $79 million increase related to the acquisition of Conning, a component of the
GenAmerica acquisition. Excluding the impact of these transactions, other revenues increased by $9 million, or 6%, to $159 million in 2000 from $150
million in 1999. This is attributable to an increase in average assets under management during the year and a change in asset mix. Despite a $1 billion, or
2%, decrease in assets under management from $57 billion as of December 31, 1999 to $56 billion at December 31, 2000, average assets under
management exceed those for the same period in 1999. The decline occurred during the fourth quarter as a result of a market downturn. Management
and advisory fees are typically calculated based on a percentage of assets under management, and are not necessarily proportionate to average assets
managed due to changes in account mix.
Other expenses increased by $8 million, or 1%, to $749 million in 2000 from $741 million in 1999. The sale of Nvest reduced other expenses by
$92 million and the acquisition of Conning increased other expenses by $90 million. Excluding the impact of these transactions, other expenses
increased by $10 million, or 5%, to $202 million in 2000 from $192 million in 1999. Approximately half of the variance is attributable to an increase in total
compensation and benefits. This expense totaled $103 million for the year 2000 and is comprised of approximately 59% base compensation and 41%
variable compensation. Base compensation increased by $2 million, or 3%, to $61 million in 2000 from $59 million in 1999, primarily due to annual salary
increases and higher staffing levels. Variable compensation increased by $3 million, or 8%, to $42 million in 2000 from $39 million in 1999. Variable
incentive payments are based upon profitability, investment portfolio performance, new business sales and growth in revenues and profits. The variable
compensation plans reward the employees for growth in their businesses, but also require them to share in the impact of any declines. General
MetLife, Inc. 19