MetLife 2001 Annual Report Download - page 19
Download and view the complete annual report
Please find page 19 of the 2001 MetLife annual report below. You can navigate through the pages in the report by either clicking on the pages listed below, or by using the keyword search tool below to find specific information within the annual report.-
 1
1 -
2
-
3
-
4
-
5
-
6
-
7
-
8
-
 9
9 -
 10
10 -
 11
11 -
 12
12 -
 13
13 -
 14
14 -
 15
15 -
 16
16 -
 17
17 -
 18
18 -
 19
19 -
 20
20 -
 21
21 -
 22
22 -
 23
23 -
 24
24 -
 25
25 -
 26
26 -
 27
27 -
 28
28 -
 29
29 -
30
-
31
-
32
-
33
-
34
-
35
-
36
-
37
-
38
-
39
-
40
-
41
-
42
-
43
-
44
-
45
-
46
-
47
-
48
-
49
-
50
-
51
-
52
-
53
-
54
-
55
-
56
-
57
-
58
-
59
-
60
-
61
-
62
-
63
-
64
-
65
-
66
-
67
-
68
-
69
-
70
-
71
-
72
-
73
-
74
-
75
-
76
-
77
-
78
-
79
-
80
-
81
 |
 |
associated with securities lending activity is included in net investment income. Other expenses related to retirement and savings rose by $83 million and
is largely attributable to $184 million in expenses associated with fourth quarter business realignment initiatives. This variance is partially offset by a
decrease in expenses, due in most part, to expense management initiatives and lower rebate expenses associated with the Company’s securities
lending program.
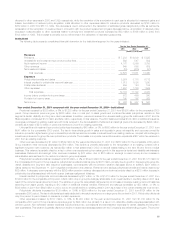
Year ended December 31, 2000 compared with the year ended December 31, 1999—Institutional
Premiums increased by $1,375 million, or 25%, to $6,900 million in 2000 from $5,525 million in 1999. Excluding the impact of the GenAmerica
acquisition, premiums increased by $1,297 million, or 23%, to $6,822 million in 2000 from $5,525 million in 1999. Group insurance premiums increased
by $953 million, or 19%, to $6,048 million in 2000 from $5,095 million in 1999. This increase is predominately the result of strong sales and continued
favorable policyholder retention in this segment’s group life, dental and disability businesses, as well as $124 million of additional insurance coverages
purchased by existing customers with funds received in the demutualization. In addition, the BMA and Lincoln National acquisitions contributed
$103 million to the variance. Retirement and savings premiums increased by $344 million, or 80%, to $774 million in 2000 from $430 million in 1999,
primarily due to significant premiums received from existing customers in 2000.
Universal life and investment-type product policy fees increased by $45 million, or 9%, to $547 million in 2000 from $502 million in 1999. Excluding
the impact of the GenAmerica acquisition, universal life and investment-type product policy fees increased by $6 million, or 1%, to $508 million in 2000
from $502 million in 1999. This increase reflects growth in group universal life products.
Other revenues increased by $41 million, or 7%, to $650 million in 2000 from $609 million in 1999. Excluding the impact of the GenAmerica
acquisition, other revenues increased by $33 million, or 5%, to $642 million in 2000 from $609 million in 1999. Group insurance other revenues
increased by $53 million, or 18%, to $355 million in 2000 from $302 million in 1999. The primary driver of this increase was strong sales growth in this
segment’s dental and disability administrative services businesses. Retirement and savings other revenues decreased by $20 million, or 7%, to
$287 million in 2000 from $307 million in 1999, primarily due to a special performance fee received in 1999.
Policyholder benefits and claims increased by $1,466 million, or 22%, to $8,178 million in 2000 from $6,712 million in 1999. Excluding the impact of
the GenAmerica acquisition, policyholder benefits and claims increased by $1,366 million, or 20%, to $8,078 million in 2000 from $6,712 million in 1999.
Group life increased by $411 million, or 12%, to $3,941 million in 2000 from $3,530 million in 1999, primarily due to overall growth in the business,
commensurate with the premium variance discussed above. Non-medical health increased by $614 million, or 46%, to $1,941 million in 2000 from
$1,327 million in 1999. This increase is largely attributable to significant growth in this segment’s dental and disability businesses. In addition, the BMA
and Lincoln National acquisitions contributed to the variance. Retirement and savings increased by $341 million, or 18%, to $2,196 million in 2000 from
$1,855 million in 1999 commensurate with the premium variance above.
Interest credited to policyholder account balances increased by $60 million, or 6%, to $1,090 million in 2000 from $1,030 million in 1999. Excluding
the impact of the GenAmerica acquisition, interest credited to policyholder account balances increased by $54 million, or 5%, to $1,084 million in 2000
from $1,030 million in 1999. Group insurance increased by $84 million, or 21%, to $482 million in 2000 from $398 million in 1999. This increase is
primarily due to asset growth in customer account balances and the bank-owned life insurance business, as well as an increase in the cash values of
executive and corporate-owned universal life plans. Retirement and savings decreased by $30 million, or 5%, to $602 million in 2000 from $632 million in
1999, due to a continued shift in customers’ investment preferences from guaranteed interest products to separate account alternatives.
Policyholder dividends decreased by $35 million, or 22%, to $124 million in 2000 from $159 million in 1999. Policyholder dividends vary from period
to period based on participating group insurance contract experience.
Other expenses increased by $161 million, or 10%, to $1,730 million in 2000 from $1,569 million in 1999. Excluding the impact of the GenAmerica
acquisition, expenses increased by $123 million, or 8%, to $1,692 million in 2000 from $1,569 million in 1999. Other expenses related to group life
increased by $56 million, or 15%, to $438 million in 2000 from $382 million in 1999. Other expenses related to group non-medical health increased by
$12 million, or 2%, to $685 million in 2000 from $673 million in 1999. Other expenses related to retirement and savings increased by $55 million, or 11%,
to $569 million in 2000 from $514 million in 1999. These increases are primarily due to costs incurred in connection with initiatives that focused on
improving service delivery capabilities through investments in technology and higher expenses associated with the Company’s securities lending
program. The income associated with securities lending activity is included in net investment income. In addition, an increase in volume-related expenses
associated with premium growth contributed to the variance. Volume-related expenses include premium taxes, separate account investment manage-
ment expenses and commissions.
MetLife, Inc.
16