MetLife 2001 Annual Report Download - page 34
Download and view the complete annual report
Please find page 34 of the 2001 MetLife annual report below. You can navigate through the pages in the report by either clicking on the pages listed below, or by using the keyword search tool below to find specific information within the annual report.-
 1
1 -
2
-
3
-
4
-
5
-
6
-
7
-
8
-
9
-
10
-
11
-
12
-
13
-
14
-
15
-
16
-
17
-
18
-
19
-
20
-
21
-
22
-
23
-
 24
24 -
 25
25 -
 26
26 -
 27
27 -
 28
28 -
 29
29 -
 30
30 -
 31
31 -
 32
32 -
 33
33 -
 34
34 -
 35
35 -
 36
36 -
 37
37 -
 38
38 -
 39
39 -
 40
40 -
 41
41 -
 42
42 -
 43
43 -
 44
44 -
45
-
46
-
47
-
48
-
49
-
50
-
51
-
52
-
53
-
54
-
55
-
56
-
57
-
58
-
59
-
60
-
61
-
62
-
63
-
64
-
65
-
66
-
67
-
68
-
69
-
70
-
71
-
72
-
73
-
74
-
75
-
76
-
77
-
78
-
79
-
80
-
81
 |
 |

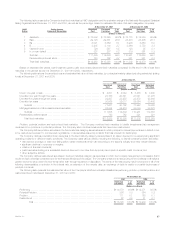
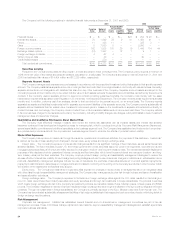
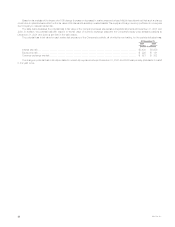
The following table presents the amortized cost and valuation allowances for commercial mortgage loans distributed by loan classification at
December 31, 2001 and 2000:
At December 31, 2001 At December 31, 2000
% of % of
Amortized % of Valuation Amortized Amortized % of Valuation Amortized
Cost(1) Total Allowance Cost Cost(1) Total Allowance Cost
(Dollars in millions)
Performing ******************************************** $17,495 96.6% $ 52 0.3% $16,169 95.5% $15 0.1%
Restructured******************************************* 448 2.5 55 12.3% 646 3.8 47 7.3%
Delinquent or under foreclosure*************************** 14 0.1 7 50.0% 24 0.1 4 16.7%
Potentially delinquent************************************ 136 0.8 20 14.7% 106 0.6 10 9.4%
Total ***************************************** $18,093 100.0% $134 0.7% $16,945 100.0% $76 0.4%
(1) Amortized cost is equal to carrying value before valuation allowances.
The following table presents the changes in valuation allowances for commercial mortgage loans for the years ended December 31, 2001, 2000
and 1999:
Year ended December 31,
2001 2000 1999
(Dollars in millions)
Balance, beginning of period ********************************************************************** $ 76 $ 69 $ 142
Additions*************************************************************************************** 84 61 36
Deductions for writedowns and dispositions ********************************************************* (26) (54) (109)
Balance, end of period *************************************************************************** $134 $ 76 $ 69
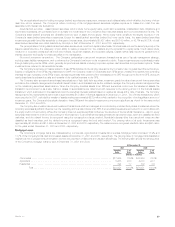
The principal risks in holding commercial mortgage loans are property specific, supply and demand, financial and capital market risks. Property
specific risks include the geographic location of the property, the physical condition of the property, the diversity of tenants and the rollover of their leases
and the ability of the property manager to attract tenants and manage expenses. Supply and demand risks include changes in the supply and/or demand
for rental space which cause changes in vacancy rates and/or rental rates. Financial risks include the overall level of debt on the property and the amount
of principal repaid during the loan term. Capital market risks include the general level of interest rates, the liquidity for these securities in the marketplace
and the capital available loan for refinancing.
Agricultural mortgage loans. The Company diversifies its agricultural mortgage loans by both geographic region and product type. The Company
manages these investments through a network of regional offices and field professionals overseen by its investment department.
Approximately 61.9% of the $5,268 million of agricultural mortgage loans outstanding at December 31, 2001 was subject to rate resets prior to
maturity. A substantial portion of these loans were successfully renegotiated and remain outstanding to maturity. The process and policies for monitoring
the agricultural mortgage loans and classifying them by performance status are generally the same as those for the commercial loans.
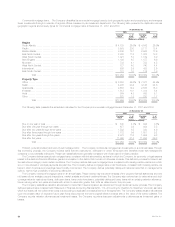
The following table presents the amortized cost and valuation allowances for agricultural mortgage loans distributed by loan classification at
December 31, 2001 and 2000:
At December 31, 2001 At December 31, 2000
% of % of
Amortized % of Valuation Amortized Amortized % of Valuation Amortized
Cost(1) Total Allowance Cost Cost(1) Total Allowance Cost
(Dollars in millions)
Performing ************************************************** $5,055 95.8% $3 0.1% $4,771 95.7% $ 1 0.0%
Restructured************************************************* 188 3.6 3 1.6% 172 3.5 2 1.2%
Delinquent or under foreclosure********************************* 29 0.5 2 6.9% 24 0.5 4 16.7%
Potentially delinquent****************************************** 5 0.1 1 20.0% 13 0.3 — 0.0%
Total *********************************************** $5,277 100.0% $9 0.2% $4,980 100.0% $ 7 0.1%
(1) Amortized cost is equal to carrying value before valuation allowances.
The following table presents the changes in valuation allowances for agricultural mortgage loans for the years ended December 31, 2001, 2000 and
1999:
Year ended December 31,
2001 2000 1999
(Dollars in millions)
Balance, beginning of period ************************************************************************ $7 $18 $28
Additions **************************************************************************************** 21 8 4
Deductions for writedowns and dispositions *********************************************************** (19) (19) (14)
Balance, end of period***************************************************************************** $9 $7 $18
The principal risks in holding agricultural mortgage loans are property specific, supply and demand, and financial and capital market risks. Property
specific risks include the geographic location of the property, soil types, weather conditions and other factors that may impact the borrower’s guaranty.
Supply and demand risks include the supply and demand for the commodities produced on the specific property and the related price for those
MetLife, Inc. 31