MetLife 2001 Annual Report Download - page 63
Download and view the complete annual report
Please find page 63 of the 2001 MetLife annual report below. You can navigate through the pages in the report by either clicking on the pages listed below, or by using the keyword search tool below to find specific information within the annual report.-
 1
1 -
2
-
3
-
4
-
5
-
6
-
7
-
8
-
9
-
10
-
11
-
12
-
13
-
14
-
15
-
16
-
17
-
18
-
19
-
20
-
21
-
22
-
23
-
24
-
25
-
26
-
27
-
28
-
29
-
30
-
31
-
32
-
33
-
34
-
35
-
36
-
37
-
38
-
39
-
40
-
41
-
42
-
43
-
44
-
45
-
46
-
47
-
48
-
49
-
50
-
51
-
52
-
 53
53 -
 54
54 -
 55
55 -
 56
56 -
 57
57 -
 58
58 -
 59
59 -
 60
60 -
 61
61 -
 62
62 -
 63
63 -
 64
64 -
 65
65 -
 66
66 -
 67
67 -
 68
68 -
 69
69 -
 70
70 -
 71
71 -
 72
72 -
 73
73 -
74
-
75
-
76
-
77
-
78
-
79
-
80
-
81
 |
 |

METLIFE, INC.
NOTES TO CONSOLIDATED FINANCIAL STATEMENTS — (Continued)
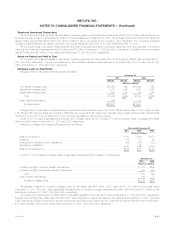
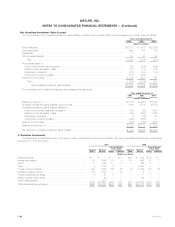
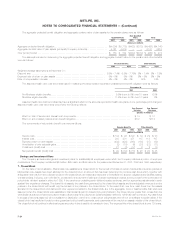
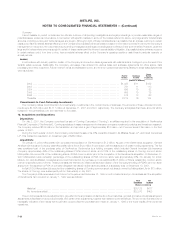
The aggregate projected benefit obligation and aggregate contract value of plan assets for the pension plans were as follows:
Non-Qualified
Qualified Plans Plans Total
2001 2000 2001 2000 2001 2000
(Dollars in millions)
Aggregate projected benefit obligation ********************************************* $(4,006) $(3,775) $(420) $(370) $(4,426) $(4,145)
Aggregate contract value of plan assets (principally Company contracts)***************** 4,161 4,619 — — 4,161 4,619
Over (under) funded ************************************************************ $ 155 $ 844 $(420) $(370) $ (265) $ 474
The assumptions used in determining the aggregate projected benefit obligation and aggregate contract value for the pension and other benefits
were as follows:
Pension Benefits Other Benefits
2001 2000 2001 2000
Weighted average assumptions at December 31:
Discount rate **************************************************************** 6.9% – 7.4% 6.9% – 7.75% 6% – 7.4% 6% – 7.5%
Expected rate of return on plan assets ******************************************* 8% – 9% 8% – 9% 6% – 9% 6% – 9%
Rate of compensation increase ************************************************* 4% – 6% 4% – 6% N/A N/A
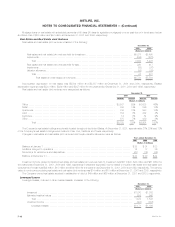
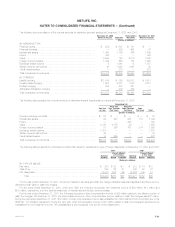
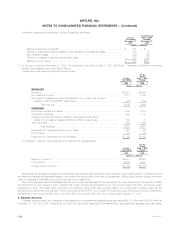
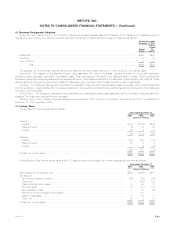
The assumed health care cost trend rates used in measuring the accumulated nonpension postretirement benefit obligation were as follows:
December 31,
2001 2000
Pre-Medicare eligible benefits****************************************************** 9.5% down to 5% over 10 years 6.5%
Medicare eligible benefits ********************************************************* 11.5% down to 5% over 10 years 6%
Assumed health care cost trend rates may have a significant effect on the amounts reported for health care plans. A one-percentage point change in
assumed health care cost trend rates would have the following effects:
One Percent One Percent
Increase Decrease
(Dollars in millions)
Effect on total of service and interest cost components *********************************************** $15 $12
Effect on accumulated postretirement benefit obligation *********************************************** $137 $114
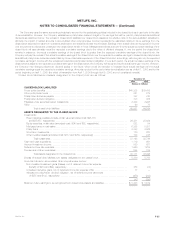
The components of net periodic benefit cost were as follows:
Pension Benefits Other Benefits
2001 2000 1999 2001 2000 1999
(Dollars in millions)
Service cost ****************************************************************** $ 104 $ 98 $ 100 $ 34 $ 29 $ 28
Interest cost******************************************************************* 308 291 271 115 113 107
Expected return on plan assets ************************************************** (402) (420) (363) (108) (97) (89)
Amortization of prior actuarial gains************************************************ (2) (19) (6) (27) (22) (11)
Curtailment (credit) cost ********************************************************* 21 (3) (17) 6 2 10
Net periodic benefit (credit) cost ************************************************** $ 29 $ (53) $ (15) $ 20 $ 25 $ 45
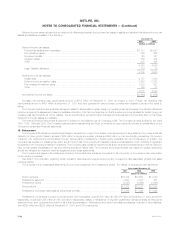
Savings and Investment Plans
The Company sponsors savings and investment plans for substantially all employees under which the Company matches a portion of employee
contributions. The Company contributed $64 million, $65 million and $45 million for the years ended December 31, 2001, 2000 and 1999, respectively.
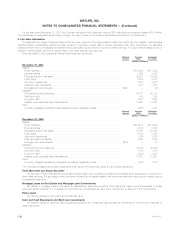
7. Closed Block
On the date of demutualization, Metropolitan Life established a closed block for the benefit of holders of certain individual life insurance policies of
Metropolitan Life. Assets have been allocated to the closed block in an amount that has been determined to produce cash flows which, together with
anticipated revenues from the policies included in the closed block, are reasonably expected to be sufficient to support obligations and liabilities relating
to these policies, including, but not limited to, provisions for the payment of claims and certain expenses and taxes, and to provide for the continuation of
policyholder dividend scales in effect for 1999, if the experience underlying such dividend scales continues, and for appropriate adjustments in such
scales if the experience changes. The closed block assets, the cash flows generated by the closed block assets and the anticipated revenues from the
policies in the closed block will benefit only the holders of the policies in the closed block. To the extent that, over time, cash flows from the assets
allocated to the closed block and claims and other experience related to the closed block are, in the aggregate, more or less favorable than what was
assumed when the closed block was established, total dividends paid to closed block policyholders in the future may be greater than or less than the
total dividends that would have been paid to these policyholders if the policyholder dividend scales in effect for 1999 had been continued. Any cash flows
in excess of amounts assumed will be available for distribution over time to closed block policyholders and will not be available to stockholders. If the
closed block has insufficient funds to make guaranteed policy benefit payments, such payments will be made from assets outside of the closed block.
The closed block will continue in effect as long as any policy in the closed block remains in-force. The expected life of the closed block is over 100 years.
MetLife, Inc.
F-24