MetLife 2001 Annual Report Download - page 30
Download and view the complete annual report
Please find page 30 of the 2001 MetLife annual report below. You can navigate through the pages in the report by either clicking on the pages listed below, or by using the keyword search tool below to find specific information within the annual report.-
 1
1 -
2
-
3
-
4
-
5
-
6
-
7
-
8
-
9
-
10
-
11
-
12
-
13
-
14
-
15
-
16
-
17
-
18
-
19
-
 20
20 -
 21
21 -
 22
22 -
 23
23 -
 24
24 -
 25
25 -
 26
26 -
 27
27 -
 28
28 -
 29
29 -
 30
30 -
 31
31 -
 32
32 -
 33
33 -
 34
34 -
 35
35 -
 36
36 -
 37
37 -
 38
38 -
 39
39 -
 40
40 -
41
-
42
-
43
-
44
-
45
-
46
-
47
-
48
-
49
-
50
-
51
-
52
-
53
-
54
-
55
-
56
-
57
-
58
-
59
-
60
-
61
-
62
-
63
-
64
-
65
-
66
-
67
-
68
-
69
-
70
-
71
-
72
-
73
-
74
-
75
-
76
-
77
-
78
-
79
-
80
-
81
 |
 |

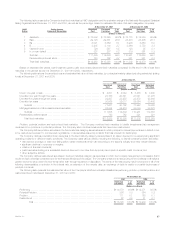
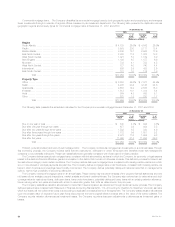
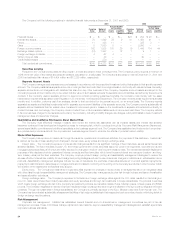
The following table presents the Company’s total fixed maturities by NAIC designation and the equivalent ratings of the Nationally Recognized Statistical
Rating Organizations at December 31, 2001 and 2000, as well as the percentage, based on estimated fair value, that each designation comprises:
At December 31, 2001 At December 31, 2000
NAIC Rating Agency Amortized Estimated % of Amortized Estimated % of
Rating Equivalent Designation Cost Fair Value Total Cost Fair Value Total
(Dollars in millions)
1 Aaa/Aa/A**************************************** $ 72,098 $ 75,265 65.2% $ 72,170 $ 74,389 65.9%
2 Baa ******************************************** 29,128 29,581 25.6 28,470 28,405 25.1
3Ba********************************************* 6,021 5,856 5.1 5,935 5,650 5.0
4B********************************************** 3,205 3,100 2.7 3,964 3,758 3.3
5 Caa and lower *********************************** 726 597 0.5 123 95 0.1
6 In or near default ********************************* 327 237 0.2 319 361 0.3
Subtotal***************************************** 111,505 114,636 99.3 110,981 112,658 99.7
Redeemable preferred stock************************ 783 762 0.7 321 321 0.3
Total fixed maturities******************************* $112,288 $115,398 100.0% $111,302 $112,979 100.0%
Based on estimated fair values, total investment grade public and private placement fixed maturities comprised 90.8% and 91.0% of total fixed
maturities in the general account at December 31, 2001 and 2000, respectively.
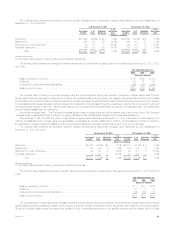
The following table shows the amortized cost and estimated fair value of fixed maturities, by contractual maturity dates (excluding scheduled sinking
funds) at December 31, 2001 and 2000:
At December 31,
2001 2000
Amortized Estimated Amortized Estimated
Cost Fair Value Cost Fair Value
(Dollars in millions)
Due in one year or less ************************************************** $ 4,001 $ 4,049 $ 3,465 $ 3,460
Due after one year through five years *************************************** 20,168 20,841 21,041 21,275
Due after five years through ten years ************************************** 22,937 23,255 23,872 23,948
Due after ten years ****************************************************** 30,565 32,017 29,564 30,402
Subtotal *********************************************************** 77,671 80,162 77,942 79,085
Mortgage-backed and other asset-backed securities ************************** 33,834 34,474 33,039 33,573
Subtotal *********************************************************** 111,505 114,636 110,981 112,658
Redeemable preferred stock ********************************************** 783 762 321 321
Total fixed maturities ************************************************* $112,288 $115,398 $111,302 $112,979
Problem, potential problem and restructured fixed maturities. The Company monitors fixed maturities to identify investments that management
considers to be problems or potential problems. The Company also monitors investments that have been restructured.
The Company defines problem securities in the fixed maturities category as securities as to which principal or interest payments are in default or are
to be restructured pursuant to commenced negotiations, or as securities issued by a debtor that has entered into bankruptcy.
The Company defines potential problem securities in the fixed maturity category as securities of an issuer deemed to be experiencing significant
operating problems or difficult industry conditions. The Company uses various criteria, including the following, to identify potential problem securities:
)debt service coverage or cash flow falling below certain thresholds which vary according to the issuer’s industry and other relevant factors;
)significant declines in revenues or margins;
)violation of financial covenants;
)public securities trading at a substantial discount deemed to be other-than-temporary as a result of specific credit concerns; and
)other subjective factors.
The Company defines restructured securities in the fixed maturities category as securities to which the Company has granted a concession that it
would not have otherwise considered but for the financial difficulties of the obligor. The Company enters into a restructuring when it believes it will realize a
greater economic value under the new terms rather than through liquidation or disposition. The terms of the restructuring may involve some or all of the
following characteristics: a reduction in the interest rate, an extension of the maturity date, an exchange of debt for equity or a partial forgiveness of
principal or interest.
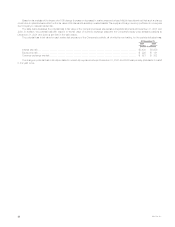
The following table presents the estimated fair value of the Company’s total fixed maturities classified as performing, problem, potential problem and
restructured fixed maturities at December 31, 2001 and 2000:
At December 31,
2001 2000
Estimated % of Estimated % of
Fair Value Total Fair Value Total
(Dollars in millions)
Performing *********************************************************************** $114,879 99.6% $112,371 99.5%
Potential Problem ***************************************************************** 386 0.3 364 0.3
Problem ************************************************************************* 111 0.1 163 0.1
Restructured ********************************************************************* 22 0.0 81 0.1
Total ******************************************************************** $115,398 100.0% $112,979 100.0%
MetLife, Inc. 27