MetLife 2001 Annual Report Download - page 14
Download and view the complete annual report
Please find page 14 of the 2001 MetLife annual report below. You can navigate through the pages in the report by either clicking on the pages listed below, or by using the keyword search tool below to find specific information within the annual report.-
 1
1 -
2
-
3
-
 4
4 -
 5
5 -
 6
6 -
 7
7 -
 8
8 -
 9
9 -
 10
10 -
 11
11 -
 12
12 -
 13
13 -
 14
14 -
 15
15 -
 16
16 -
 17
17 -
 18
18 -
 19
19 -
 20
20 -
 21
21 -
 22
22 -
 23
23 -
 24
24 -
25
-
26
-
27
-
28
-
29
-
30
-
31
-
32
-
33
-
34
-
35
-
36
-
37
-
38
-
39
-
40
-
41
-
42
-
43
-
44
-
45
-
46
-
47
-
48
-
49
-
50
-
51
-
52
-
53
-
54
-
55
-
56
-
57
-
58
-
59
-
60
-
61
-
62
-
63
-
64
-
65
-
66
-
67
-
68
-
69
-
70
-
71
-
72
-
73
-
74
-
75
-
76
-
77
-
78
-
79
-
80
-
81
 |
 |
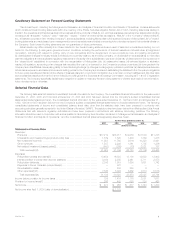
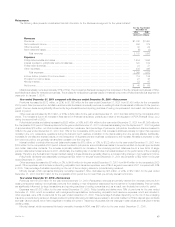
market performance on future market performance, as well as improving the ability to estimate deferred policy acquisition costs balances and related
amortization. The increase in the Reinsurance segment is primarily due to fluctuations in allowances paid to ceding companies as a result of a change in
product mix. The increase in the International segment is due to a write-off of deferred policy acquisition costs as a result of the anticipated impact of
recent economic and political events in Argentina.
Income tax expense for the year ended December 31, 2001 was $266 million, or 36%, of income before provision for income taxes, compared with
$463 million, or 33%, for the comparable 2000 period. The 2001 effective tax rate differs from the corporate tax rate of 35% due to an increase in prior
year taxes on capital gains. The 2000 effective tax rate differs from the corporate tax rate of 35% primarily due to the payments made in the second
quarter of 2000 to former Canadian policyholders in connection with the demutualization, the impact of surplus tax and a reduction in prior year taxes on
capital gains recorded in the third quarter of 2000. This reduction is associated with the previous sale of a business. Prior to its demutualization, the
Company was subject to surplus tax imposed on mutual life insurance companies under Section 809 of the Internal Revenue Code. The surplus tax
results from the disallowance of a portion of a mutual life insurance company’s policyholder dividends as a deduction from taxable income.
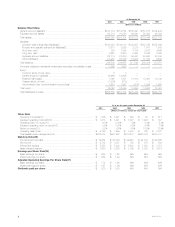
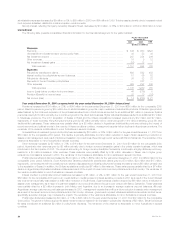
Year ended December 31, 2000 compared with the year ended December 31, 1999—The Company
Premiums increased by $4,229 million, or 35%, to $16,317 million in 2000 from $12,088 million in 1999, in part, due to the acquisition of
GenAmerica on January 6, 2000. Excluding the impact of this acquisition, premiums increased by $2,273 million, or 19%. This increase is attributable to
Institutional, Auto & Home and International. These increases are partially offset by a $72 million, or 2%, decrease in Individual. The increase of
$1,297 million, or 23%, in Institutional is predominantly the result of strong sales and continued favorable policyholder retention in this segment’s group
life, dental and disability businesses. The acquisitions of the workplace benefits division from the BMA acquisition in July 2000 and Lincoln National’s
disability business in November 1999 account for $103 million of the variance. In addition, significant premiums received from existing group life and
retirement and savings customers in 2000 contribute $468 million to the variance. The increase of $885 million, or 51%, in Auto & Home is primarily due
to the St. Paul acquisition, which represents $755 million of the increase, as well as growth in this segment’s standard auto business. The increase of
$137 million, or 26%, in International is primarily due to overall growth in Mexico, South Korea, Taiwan, Spain and Brazil. The decrease in Individual is
primarily due to a decline in sales of traditional life insurance policies, which reflects a continued shift in policyholders’ preferences from those policies to
variable life products.
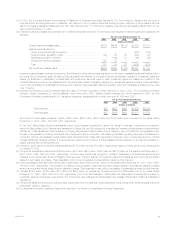
Universal life and investment-type product policy fees increased by $387 million, or 27%, to $1,820 million in 2000 from $1,433 million in 1999.
Excluding the impact of the GenAmerica acquisition, universal life and investment-type product policy fees increased by $145 million, or 10%. This
increase is almost entirely attributable to a $130 million, or 15%, increase in Individual, which is primarily due to increased sales, including exchanges, of
variable life products, increases in separate account assets and the acceleration of the recognition of unearned fees in connection with a universal life
product replacement program.
Net investment income increased by $1,952 million, or 20%, to $11,768 million in 2000 from $9,816 million in 1999. Excluding the impact of the
GenAmerica acquisition, net investment income increased by $832 million, or 8%. This increase is primarily due to higher income from (i) fixed maturities
of $653 million, or 9%, (ii) mortgage loans on real estate of $76 million, or 5%, (iii) interest on policy loans of $17 million, or 5%, (iv) cash and short-term
investments of $79 million, or 46%, (v) real estate and real estate joint ventures, net of investment expenses and depreciation, of $45 million, or 8%, and
(vi) lower investment expenses of $27 million, or 10%. These increases are partially offset by reduced income from equity securities and other limited
partnership interests of $54 million, or 23%, and other invested assets of $11 million, or 12%.
The increase in income from fixed maturities to $7,824 million in 2000 from $7,171 million in 1999 is primarily due to higher volume in the securities
lending program and income from fixed maturities which were part of the St. Paul acquisition in the fourth quarter of 1999. These increases are partially
offset by decreases in income from equity-linked notes. The increase in income from mortgage loans on real estate to $1,560 million in 2000 from
$1,484 million in 1999 is largely due to higher mortgage production volume. The reduction in income from equity securities and other limited partnership
interests to $185 million in 2000 from $239 million in 1999 is predominantly the result of a decrease in sales by corporate partnerships.
Other revenues increased by $368 million, or 20%, to $2,229 million in 2000 from $1,861 million in 1999. The impact of the GenAmerica acquisition
is an increase to other revenues of $363 million. The variance year over year, excluding the impact of GenAmerica, is partially attributable to increases in
the Individual, Institutional segments, largely offset by decreases in the Asset Management segment and in Corporate & Other. The increase of
$96 million in Individual is largely a result of higher commission and fee income related to increased sales in the broker/dealer and other subsidiaries. The
primary driver of Institutional’s $33 million increase is strong sales growth in its dental and disability administrative services businesses. A $19 million
increase in Auto & Home is attributable to a revision of an estimate of amounts recoverable from reinsurers related to the disposition of this segment’s
reinsurance business in 1990. Offsetting these increases is a $122 million decline in the Asset Management segment primarily due to the sale of Nvest,
on October 30, 2000. The remaining variance is primarily due to Corporate & Other.
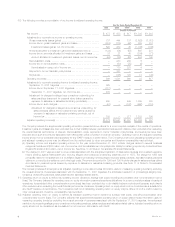
The Company’s investment gains and losses are net of related policyholder amounts. The amounts netted against investment gains and losses are
(i) deferred policy acquisition amortization, to the extent that such amortization results from investment gains and losses, (ii) additions to participating
contractholder accounts when amounts equal to such investment gains and losses are credited to the contractholder’s accounts, and (iii) adjustments to
the policyholder dividend obligation resulting from investment gains and losses.
Net investment losses increased by $320 million, or 457%, to $390 million in 2000 from $70 million in 1999. This increase reflects total gross
investment losses of $444 million, an increase of $307 million, or 224%, from $137 million in 1999, before the offsets for: the amortization of deferred
policy acquisition costs of $95 million and $46 million in 2000 and 1999, respectively; changes in the policyholder dividend obligation of $85 million in
2000; and (additions to) or reductions in participating contracts of $(126) million and $21 million in 2000 and 1999, respectively, related to assets sold.
Excluding the impact of the GenAmerica acquisition, net investment losses increased by $378 million, or 540%. This increase reflects the continuation of
the Company’s strategy to reposition its investment portfolio in order to provide a higher operating return on its invested assets and the recognition of
losses through the proactive sale of certain assets. These losses are partially offset by gains of $660 million, including a gain of $663 million, which was
recognized as a result of the sale of Nvest on October 30, 2000.
The Company believes its policy of netting related policyholder amounts against investment gains and losses provides important information in
evaluating its operating performance. Investment gains and losses are often excluded by investors when evaluating the overall financial performance of
insurers. The Company believes its presentation enables readers of its consolidated statements of income to easily exclude investment gains and losses
and the related effects on the consolidated statements of income when evaluating its operating performance. The Company’s presentation of investment
gains and losses, net of related policyholder amounts, may be different from the presentation used by other insurance companies, and therefore,
amounts in its consolidated statements of income may not be comparable to amounts reported by other insurers.
MetLife, Inc. 11