MetLife 2001 Annual Report Download - page 59
Download and view the complete annual report
Please find page 59 of the 2001 MetLife annual report below. You can navigate through the pages in the report by either clicking on the pages listed below, or by using the keyword search tool below to find specific information within the annual report.-
 1
1 -
2
-
3
-
4
-
5
-
6
-
7
-
8
-
9
-
10
-
11
-
12
-
13
-
14
-
15
-
16
-
17
-
18
-
19
-
20
-
21
-
22
-
23
-
24
-
25
-
26
-
27
-
28
-
29
-
30
-
31
-
32
-
33
-
34
-
35
-
36
-
37
-
38
-
39
-
40
-
41
-
42
-
43
-
44
-
45
-
46
-
47
-
48
-
 49
49 -
 50
50 -
 51
51 -
 52
52 -
 53
53 -
 54
54 -
 55
55 -
 56
56 -
 57
57 -
 58
58 -
 59
59 -
 60
60 -
 61
61 -
 62
62 -
 63
63 -
 64
64 -
 65
65 -
 66
66 -
 67
67 -
 68
68 -
 69
69 -
70
-
71
-
72
-
73
-
74
-
75
-
76
-
77
-
78
-
79
-
80
-
81
 |
 |

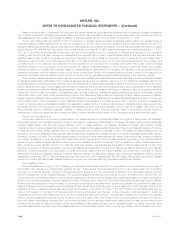
METLIFE, INC.
NOTES TO CONSOLIDATED FINANCIAL STATEMENTS — (Continued)
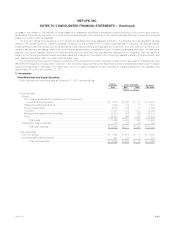
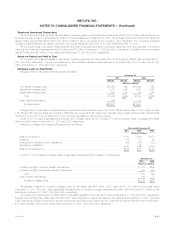
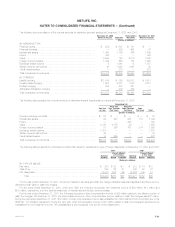
Net Unrealized Investment Gains (Losses)
The components of net unrealized investment gains (losses), included in accumulated other comprehensive income (loss), were as follows:
Years ended December 31,
2001 2000 1999
(Dollars in millions)
Fixed maturities*************************************************************************** $ 3,110 $ 1,677 $(1,828)
Equity securities ************************************************************************** 604 744 875
Derivatives ******************************************************************************* 71 — —
Other invested assets ********************************************************************* 58 58 153
Total ******************************************************************************** 3,843 2,479 (800)
Amounts allocable to:
Future policy benefit loss recognition ******************************************************* (30) (284) (249)
Deferred policy acquisition costs ********************************************************** (21) 119 709
Participating contracts ******************************************************************* (127) (133) (118)
Policyholder dividend obligation *********************************************************** (707) (385) —
Deferred income taxes********************************************************************* (1,079) (621) 161
Total ******************************************************************************** (1,964) (1,304) 503
Net unrealized investment gains (losses) ********************************************** $ 1,879 $ 1,175 $ (297)
The changes in net unrealized investment gains (losses) were as follows:
Years ended December 31,
2001 2000 1999
(Dollars in millions)
Balance at January 1 *********************************************************************** $1,175 $ (297) $ 1,540
Unrealized investment gains (losses) during the year ********************************************* 1,364 3,279 (6,583)
Unrealized investment gains (losses) relating to:
Future policy benefit (loss) gain recognition *************************************************** 254 (35) 1,999
Deferred policy acquisition costs *********************************************************** (140) (590) 1,628
Participating contracts ******************************************************************** 6 (15) 94
Policyholder dividend obligation ************************************************************ (322) (385) —
Deferred income taxes********************************************************************** (458) (782) 1,025
Balance at December 31 ******************************************************************* $1,879 $1,175 $ (297)
Net change in unrealized investment gains (losses) ********************************************** $ 704 $1,472 $(1,837)
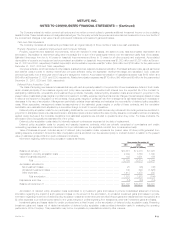
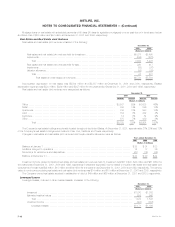
4. Derivative Instruments
The table below provides a summary of the carrying value, notional amount and current market or fair value of derivative financial instruments held at
December 31, 2001 and 2000:
2001 2000
Current Market Current Market
or Fair Value or Fair Value
Carrying Notional Carrying Notional
Value Amount Assets Liabilities Value Amount Assets Liabilities
(Dollars in millions)
Financial futures ********************************************** $— $ — $— $— $23 $ 254 $23 $—
Interest rate swaps******************************************** 70 1,849 79 9 41 1,450 41 1
Floors******************************************************* 11 325 11 — — 325 3 —
Caps ******************************************************* 5 7,890 5 — — 9,950 — —
Foreign currency swaps *************************************** 162 1,925 188 26 (1) 1,449 114 44
Exchange traded options*************************************** (12) 1,857 — 12 1 9 1 —
Forward exchange contracts************************************ 4674—— ———
Written covered call options ************************************ —40——— 40——
Credit default swaps ****************************************** — 270—— — ———
Total contractual commitments ********************************** $240 $14,223 $287 $47 $64 $13,477 $182 $45
MetLife, Inc.
F-20