MetLife 2001 Annual Report Download - page 21
Download and view the complete annual report
Please find page 21 of the 2001 MetLife annual report below. You can navigate through the pages in the report by either clicking on the pages listed below, or by using the keyword search tool below to find specific information within the annual report.-
 1
1 -
2
-
3
-
4
-
5
-
6
-
7
-
8
-
9
-
10
-
 11
11 -
 12
12 -
 13
13 -
 14
14 -
 15
15 -
 16
16 -
 17
17 -
 18
18 -
 19
19 -
 20
20 -
 21
21 -
 22
22 -
 23
23 -
 24
24 -
 25
25 -
 26
26 -
 27
27 -
 28
28 -
 29
29 -
 30
30 -
 31
31 -
32
-
33
-
34
-
35
-
36
-
37
-
38
-
39
-
40
-
41
-
42
-
43
-
44
-
45
-
46
-
47
-
48
-
49
-
50
-
51
-
52
-
53
-
54
-
55
-
56
-
57
-
58
-
59
-
60
-
61
-
62
-
63
-
64
-
65
-
66
-
67
-
68
-
69
-
70
-
71
-
72
-
73
-
74
-
75
-
76
-
77
-
78
-
79
-
80
-
81
 |
 |

Auto & Home
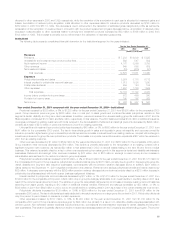
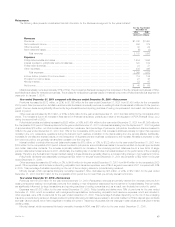
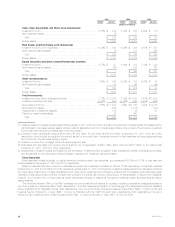
The following table presents consolidated financial information for the Auto & Home segment for the years presented:
For the Year Ended
December 31,
2001 2000 1999
(Dollars in millions)
Revenues
Premiums ************************************************************************** $2,755 $2,636 $1,751
Net investment income *************************************************************** 200 194 103
Other revenues ********************************************************************* 22 40 21
Net investment (losses) gains ********************************************************* (17) (20) 1
Total revenues ****************************************************************** 2,960 2,850 1,876
Expenses
Policyholder benefits and claims ******************************************************* 2,121 2,005 1,301
Other expenses ********************************************************************* 800 827 514
Total expenses****************************************************************** 2,921 2,832 1,815
Income before provision for income taxes *********************************************** 39 18 61
(Benefit) Provision for income taxes***************************************************** (2) (12) 5
Net income ************************************************************************ $41$30$56
Year ended December 31, 2001 compared with the year ended December 31, 2000—Auto & Home
Premiums increased by $119 million, or 5%, to $2,755 million for the year ended December 31, 2001 from $2,636 million for the comparable 2000
period. Auto premiums increased by $99 million. Property premiums increased by $17 million. Both increases were largely due to rate increases. Due to
increased rate activity, the retention ratio for the existing business declined from 90% to 89%. Premiums from other personal lines increased by $3 million.
Other revenues decreased by $18 million, or 45%, to $22 million for the year ended December 31, 2001 from $40 million for the comparable 2000
period. This decrease is primarily due to a revision of an estimate made in 2000 of amounts recoverable from reinsurers related to the disposition of this
segment’s reinsurance business in 1990.
Policyholder benefits and claims increased by $116 million, or 6%, to $2,121 million for the year ended December 31, 2001 from $2,005 million for the
comparable 2000 period. Auto policyholder benefits and claims increased by $62 million due to increased average claim costs, growth in the business and
adverse weather in the first quarter of 2001. Despite this increase, the auto loss ratio decreased to 75.9% in 2001 from 76.6% in 2000 as a result of higher
premiums per policy. Property policyholder benefits and claims increased by $41 million due to increased non-catastrophe weather-related losses in 2001.
Correspondingly, the property loss ratio increased to 80.7% in 2001 from 76.4% in 2000. Catastrophes represented 13.5% of the loss ratio in 2001
compared to 17.3% in 2000. Other policyholder benefits and claims grew by $13 million, primarily due to an increase in high liability personal umbrella claims.
This segment tends to be very volatile in the shorter-term versus a longer-term business cycle due to low premium volume and high liability limits.
Other expenses decreased by $27 million, or 3%, to $800 million for the year ended December 31, 2001 from $827 million for the comparable
2000 period. This decrease is due to a reduction in integration costs associated with the St. Paul acquisition. The expense ratio decreased to 29.0% in
2001 from 31.4% in 2000.
The effective income tax rates for the years ended December 31, 2001 and 2000 differ from the corporate tax rate of 35% due to the impact of non-
taxable investment income.
Year ended December 31, 2000 compared with the year ended December 31, 1999—Auto & Home
Premiums increased by $885 million, or 51%, to $2,636 million in 2000 from $1,751 million in 1999, primarily due to the St. Paul acquisition in 1999.
Excluding the impact of the St. Paul acquisition, premiums increased by $130 million, or 9%. Auto premiums increased by $95 million, or 8%, to
$1,313 million in 2000 from $1,218 million in 1999. This increase is primarily due to growth in the standard auto insurance book of business, which was
attributable to increased new business production resulting from an increase in independent agents in this segment’s sales force and improved retention in
the existing business. Policyholder retention in the standard auto business increased by 1% to 89%. Homeowner premiums increased by $27 million, or
11%, to $282 million in 2000 from $255 million in 1999 due to higher new business production as a result of a larger sales force and an increase in
policyholder retention of 2% to 91% in 2000 from 89% in 1999. Premiums from other personal lines increased by 44% to $26 million in 2000 from $18 million
in 1999.
Other revenues increased by $19 million, or 90%, to $40 million in 2000 from $21 million in 1999, primarily due to a revision of an estimate of
amounts recoverable from reinsurers related to the disposition of this segment’s reinsurance business in 1990.
Expenses increased by $1,017 million, or 56%, to $2,832 million in 2000 from $1,815 million in 1999. Excluding the impact of the St. Paul
acquisition, expenses increased by $152 million, or 10%, which resulted in an increase in the combined ratio to 103.9% in 2000 from 102.8% in 1999.
As discussed below, higher overall loss costs, predominately in the homeowners line, is the primary cause of this increase.
Policyholder benefits and claims increased by $704 million, or 54%, to $2,005 million in 2000 from $1,301 million in 1999. Automobile policyholder
benefits and claims increased by $438 million, or 42%, to $1,490 million in 2000 from $1,052 million in 1999. Homeowner policyholder benefits and
claims increased by $260 million, or 112%, to $493 million in 2000 from $233 million in 1999. Other policyholder benefits and claims increased by
$6 million, or 38%, to $22 million in 2000 from $16 million in 1999. Correspondingly, the auto loss ratio increased to 76.6% in 2000 from 76.1% in 1999
and the homeowners loss ratio increased to 76.4% from 67.2% in 1999. The increase in the homeowners loss ratio is primarily due to higher catastrophe
losses and expenses, predominantly in the St. Paul book of business. Catastrophes, including multiple storms and the Los Alamos fire, resulted in an
increase in the catastrophe loss ratio to 17.3% in 2000 from 6.3% in 1999.
Excluding the impact of the St. Paul acquisition, policyholder benefits and claims increased by $124 million, or 11%. Auto policyholder benefits and
claims increased by $102 million, or 11%, to $1,041 million in 2000 from $939 million in 1999. This is largely attributable to a 9% increase in the number
of policies in force and increased costs resulting from an increase in the use of original equipment manufacturer parts and higher labor rates. The auto
loss ratio increased to 79.3% in 2000 from 77.1% in 1999. Homeowners benefits and claims increased by $23 million, or 14%, to $186 million in 2000
MetLife, Inc.
18