MetLife 2001 Annual Report Download - page 31
Download and view the complete annual report
Please find page 31 of the 2001 MetLife annual report below. You can navigate through the pages in the report by either clicking on the pages listed below, or by using the keyword search tool below to find specific information within the annual report.-
 1
1 -
2
-
3
-
4
-
5
-
6
-
7
-
8
-
9
-
10
-
11
-
12
-
13
-
14
-
15
-
16
-
17
-
18
-
19
-
20
-
 21
21 -
 22
22 -
 23
23 -
 24
24 -
 25
25 -
 26
26 -
 27
27 -
 28
28 -
 29
29 -
 30
30 -
 31
31 -
 32
32 -
 33
33 -
 34
34 -
 35
35 -
 36
36 -
 37
37 -
 38
38 -
 39
39 -
 40
40 -
 41
41 -
42
-
43
-
44
-
45
-
46
-
47
-
48
-
49
-
50
-
51
-
52
-
53
-
54
-
55
-
56
-
57
-
58
-
59
-
60
-
61
-
62
-
63
-
64
-
65
-
66
-
67
-
68
-
69
-
70
-
71
-
72
-
73
-
74
-
75
-
76
-
77
-
78
-
79
-
80
-
81
 |
 |

The Company classifies all of its fixed maturities as available-for-sale and marks them to market. The Company writes down to fair value fixed
maturities that it deems to be other than temporarily impaired. The Company records write-downs as investment losses and adjusts the cost basis of the
fixed maturities accordingly. The Company does not change the revised cost basis for subsequent recoveries in value. Such write-downs were
$273 million and $339 million for the years ended December 31, 2001 and 2000, respectively.
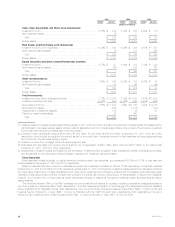
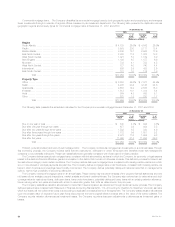
Fixed maturities by sector. The Company diversifies its fixed maturities by security sector. The following table sets forth the estimated fair value of
the Company’s fixed maturities by sector, as well as the percentage of the total fixed maturities holdings that each security sector comprised at
December 31, 2001 and 2000:
At December 31,
2001 2000
Estimated % of Estimated % of
Fair Value Total Fair Value Total
(Dollars in millions)
U.S. treasuries/agencies *********************************************************** $ 9,213 8.0% $ 9,634 8.5%
Corporate securities *************************************************************** 62,656 54.3 60,675 53.8
Foreign government securities******************************************************* 4,890 4.2 5,341 4.7
Mortgage-backed securities ******************************************************** 26,328 22.8 25,726 22.8
Asset-backed securities************************************************************ 8,146 7.1 7,847 6.9
Other fixed income assets********************************************************** 4,165 3.6 3,756 3.3
Total ******************************************************************** $115,398 100.0% $112,979 100.0%
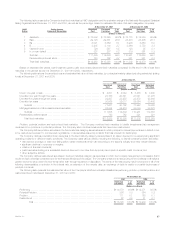
Corporate fixed maturities. The table below shows the major industry types that comprise the corporate bond holdings at the dates indicated:
At December 31,
2001 2000
Estimated % of Estimated % of
Fair Value Total Fair Value Total
(Dollars in millions)
Industrial ************************************************************************ $27,346 43.7% $27,369 45.1%
Utility *************************************************************************** 7,030 11.2 7,014 11.6
Finance************************************************************************* 12,997 20.7 12,729 21.0
Yankee/Foreign(1) **************************************************************** 14,767 23.6 13,233 21.8
Other ************************************************************************** 516 0.8 330 0.5
Total ******************************************************************* $62,656 100.0% $60,675 100.0%
(1) Includes publicly traded, dollar-denominated debt obligations of foreign obligors, known as Yankee bonds, and other foreign investments.
The Company diversifies its corporate bond holdings by industry and issuer. The portfolio has no exposure to any single issuer in excess of 1% of its
total invested assets. At December 31, 2001, the Company’s combined holdings in the ten issuers to which it had the greatest exposure totaled
$4,176 million, which was less than 3% of the Company’s total invested assets at such date. The exposure to the largest single issuer of corporate
bonds the Company held at December 31, 2001 was $598 million.
At December 31, 2001, investments of $7,120 million, or 48.2% of the Yankee/Foreign sector, represented exposure to traditional Yankee bonds.
The balance of this exposure was primarily dollar-denominated, foreign private placements and project finance loans. The Company diversifies the
Yankee/Foreign portfolio by country and issuer.
The Company does not have material exposure to foreign currency risk in its invested assets. In the Company’s international insurance operations,
both its assets and liabilities are generally denominated in local currencies. Foreign currency denominated securities supporting U.S. dollar liabilities are
generally swapped back into U.S. dollars.
The Company’s exposure to future deterioration in the economic and political environment in Argentina, with respect to its Argentine-related
investments, is limited to the net carrying value of those assets, which totaled less than $300 million as of December 31, 2001.
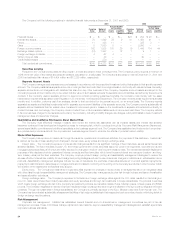
Mortgage-backed securities. The following table shows the types of mortgage-backed securities the Company held at December 31, 2001 and
2000:
At December 31,
2001 2000
Estimated % of Estimated % of
Fair Value Total Fair Value Total
(Dollars in millions)
Pass-through securities *********************************************************** $10,542 40.0% $10,610 41.3%
Collateralized mortgage obligations ************************************************** 10,432 39.7 9,866 38.3
Commercial mortgage-backed securities ********************************************* 5,354 20.3 5,250 20.4
Total ******************************************************************* $26,328 100.0% $25,726 100.0%
At December 31, 2001, pass-through and collateralized mortgage obligations totaled $20,974 million, or 79.7% of total mortgage-backed
securities, and a majority of this amount represented agency-issued pass-through and collateralized mortgage obligations guaranteed or otherwise
supported by the Federal National Mortgage Association, the Federal Home Loan Mortgage Corporation or the Government National Mortgage
Association. Other types of mortgage-backed securities comprised the balance of such amounts reflected in the table. At December 31, 2001,
approximately $2,955 million, or 55.2% of the commercial mortgage-backed securities, and $20,194 million, or 96.3% of the pass-through securities and
collateralized mortgage obligations, were rated Aaa/AAA by Moody’s or S&P.
MetLife, Inc.
28