MetLife 2001 Annual Report Download - page 16
Download and view the complete annual report
Please find page 16 of the 2001 MetLife annual report below. You can navigate through the pages in the report by either clicking on the pages listed below, or by using the keyword search tool below to find specific information within the annual report.-
 1
1 -
2
-
3
-
4
-
5
-
 6
6 -
 7
7 -
 8
8 -
 9
9 -
 10
10 -
 11
11 -
 12
12 -
 13
13 -
 14
14 -
 15
15 -
 16
16 -
 17
17 -
 18
18 -
 19
19 -
 20
20 -
 21
21 -
 22
22 -
 23
23 -
 24
24 -
 25
25 -
 26
26 -
27
-
28
-
29
-
30
-
31
-
32
-
33
-
34
-
35
-
36
-
37
-
38
-
39
-
40
-
41
-
42
-
43
-
44
-
45
-
46
-
47
-
48
-
49
-
50
-
51
-
52
-
53
-
54
-
55
-
56
-
57
-
58
-
59
-
60
-
61
-
62
-
63
-
64
-
65
-
66
-
67
-
68
-
69
-
70
-
71
-
72
-
73
-
74
-
75
-
76
-
77
-
78
-
79
-
80
-
81
 |
 |

Individual
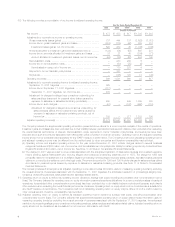
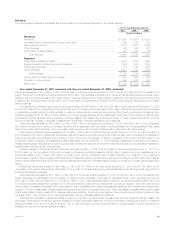
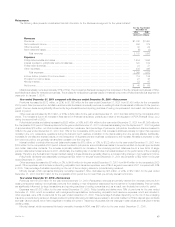
The following table presents consolidated financial information for the Individual segment for the years indicated:
For the Year Ended December 31,
2001 2000 1999
(Dollars in millions)
Revenues
Premiums*********************************************************************** $ 4,563 $ 4,673 $ 4,289
Universal life and investment-type product policy fees ********************************** 1,260 1,221 888
Net investment income *********************************************************** 6,512 6,475 5,346
Other revenues ****************************************************************** 495 650 381
Net investment gains (losses) ****************************************************** 827 227 (14)
Total revenues 13,657 13,246 10,890
Expenses
Policyholder benefits and claims **************************************************** 5,233 5,054 4,625
Interest credited to policyholder account balances ************************************* 1,898 1,680 1,359
Policyholder dividends ************************************************************ 1,767 1,742 1,509
Other expenses ***************************************************************** 3,012 3,323 2,542
Total expenses ************************************************************** 11,910 11,799 10,035
Income before provision for income taxes ******************************************** 1,747 1,447 855
Provision for income taxes********************************************************* 652 527 300
Net income ********************************************************************* $ 1,095 $ 920 $ 555
Year ended December 31, 2001 compared with the year ended December 31, 2000—Individual
Premiums decreased by $110 million, or 2%, to $4,563 million for the year ended December 31, 2001 from $4,673 million for the comparable 2000
period. Premiums from insurance products declined by $108 million. This decrease is primarily due to declines in traditional life insurance policies, which
reflects a maturing of that business and a continued shift in customer preference from those policies to variable life products. Premiums from annuity and
investment-type products declined by $2 million, due to lower sales of supplementary contracts with life contingencies and single premium immediate
annuity business.
Universal life and investment-type product policy fees increased by $39 million, or 3%, to $1,260 million for the year ended December 31, 2001
from $1,221 million for the comparable 2000 period. Policy fees from insurance products rose by $149 million. This growth is primarily due to increases
in variable life products reflecting a continued shift in customer preferences from traditional life products. Policy fees from annuity and investment-type
products decreased by $110 million, primarily resulting from a lower average separate account asset base. Policy fees from annuity and investment-type
products are typically calculated as a percentage of average assets. Such assets can fluctuate depending on equity market performance. Thus, the
amount of fees can increase or decrease consistent with movements in average separate account balances.
Other revenues decreased by $155 million, or 24%, to $495 million for the year ended December 31, 2001 from $650 million for the comparable
2000 period, primarily due to reduced commission and fee income associated with lower sales in the broker/dealer and other subsidiaries, which was a
result of the equity market downturn. Such commission and fee income can fluctuate consistent with movements in the equity market.
Policyholder benefits and claims increased by $179 million, or 4%, to $5,233 million for the year ended December 31, 2001 from $5,054 million for
the comparable 2000 period. Policyholder benefits and claims for insurance products rose by $192 million primarily due to increases in the liabilities for
future policy benefits commensurate with the aging of the in-force block of business. In addition, increases of $74 million and $24 million in the
policyholder dividend obligation and liabilities and claims associated with the September 11, 2001 tragedies, respectively, contributed to the variance.
Partially offsetting these variances is a reduction in policyholder benefits and claims for annuity and investment products due to a decrease in liabilities for
supplemental contracts with life contingencies.
Interest credited to policyholder account balances rose by $218 million, or 13%, to $1,898 million for the year ended December 31, 2001 from
$1,680 million for the comparable 2000 period. Interest on insurance products increased by $165 million, primarily due to the establishment of a
policyholder liability of $118 million with respect to certain group annuity contracts at New England Financial. The remainder of the variance is
predominately a result of higher average policyholder account balances. Interest on annuity and investment products grew by $53 million due to slightly
higher crediting rates and higher policyholder account balances stemming from increased sales, including products with a dollar cost averaging-type
feature.
Policyholder dividends increased by $25 million, or 1%, to $1,767 million for the year ended December 31, 2001 from $1,742 million for the
comparable 2000 period. This is largely attributable to the growth in the assets supporting policies associated with this segment’s aging block of
traditional life insurance business.
Other expenses decreased by $311 million, or 9%, to $3,012 for the year ended December 31, 2001 from $3,323 million for the comparable 2000
period. Excluding the capitalization and amortization of deferred policy acquisition costs that are discussed below, other expenses are lower by
$167 million, or 5%, to $3,305 million in 2001 from $3,472 million in 2000. Other expenses related to insurance products decreased by $204 million due
to continued expense management, primarily due to reduced employee costs and lower discretionary spending. In addition, there were reductions in
volume-related commission expenses in the broker/dealer and other subsidiaries and rebate expenses associated with the Company’s securities lending
program. The income associated with securities lending activity is included in net investment income. These decreases are partially offset by an increase
of $62 million related to fourth quarter 2001 business realignment initiatives. The annuity and investment-type products experienced an increase in other
expenses of $37 million primarily due to expenses associated with the business realignment initiatives.
Deferred policy acquisition costs are principally amortized in proportion to gross margins or gross profits, including investment gains or losses. The
amortization is allocated to investment gains and losses to provide consolidated statement of income information regarding the impact of investment
gains and losses on the amount of the amortization, and to other expenses to provide amounts related to gross margins or profits originating from
transactions other than investment gains and losses.
MetLife, Inc. 13