MetLife 2001 Annual Report Download - page 28
Download and view the complete annual report
Please find page 28 of the 2001 MetLife annual report below. You can navigate through the pages in the report by either clicking on the pages listed below, or by using the keyword search tool below to find specific information within the annual report.-
 1
1 -
2
-
3
-
4
-
5
-
6
-
7
-
8
-
9
-
10
-
11
-
12
-
13
-
14
-
15
-
16
-
17
-
 18
18 -
 19
19 -
 20
20 -
 21
21 -
 22
22 -
 23
23 -
 24
24 -
 25
25 -
 26
26 -
 27
27 -
 28
28 -
 29
29 -
 30
30 -
 31
31 -
 32
32 -
 33
33 -
 34
34 -
 35
35 -
 36
36 -
 37
37 -
 38
38 -
39
-
40
-
41
-
42
-
43
-
44
-
45
-
46
-
47
-
48
-
49
-
50
-
51
-
52
-
53
-
54
-
55
-
56
-
57
-
58
-
59
-
60
-
61
-
62
-
63
-
64
-
65
-
66
-
67
-
68
-
69
-
70
-
71
-
72
-
73
-
74
-
75
-
76
-
77
-
78
-
79
-
80
-
81
 |
 |

unless the SPE can meet certain independent economic substance criteria. It is not possible to determine at this time what conclusions will be included in
the final interpretation; however, the result could impact the accounting treatment of these entities by the Company.
The FASB is currently deliberating the issuance of a proposed statement that would amend SFAS No. 133. The proposed statement will address
and resolve certain pending Derivatives Implementation Group (‘‘DIG’’) issues. The outcome of the pending DIG issues and other provisions of the
statement could impact the Company’s accounting for beneficial interests, loan commitments and other transactions deemed to be derivatives under the
new statement. The Company’s accounting for such transactions is currently based on management’s interpretation of the accounting literature as of
March 18, 2002.
Investments
The Company had total cash and invested assets at December 31, 2001 of $169.7 billion. In addition, the Company had $62.7 billion held in its
separate accounts, for which the Company generally does not bear investment risk.
The Company’s primary investment objective is to maximize after-tax operating income consistent with acceptable risk parameters. The Company is
exposed to three primary sources of investment risk:
)credit risk, relating to the uncertainty associated with the continued ability of a given obligor to make timely payments of principal and interest;
)interest rate risk, relating to the market price and cash flow variability associated with changes in market interest rates; and
)market valuation risk for equity holdings.
The Company manages risk through in-house fundamental analysis of the underlying obligors, issuers, transaction structures and real estate
properties. The Company also manages credit risk and market valuation risk through industry and issuer diversification and asset allocation. For real
estate and agricultural assets, the Company manages credit risk and valuation risk through geographic, property type, and product type diversification
and asset allocation. The Company manages interest rate risk as part of its asset and liability management strategies, product design, such as the use of
market value adjustment features and surrender charges, and proactive monitoring and management of certain non-guaranteed elements of its products,
such as the resetting of credited interest and dividend rates for policies that permit such adjustments.
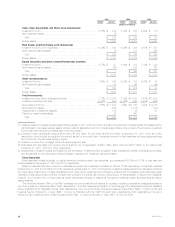
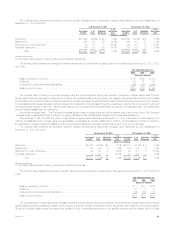
The following table summarizes the Company’s cash and invested assets at December 31, 2001 and December 31, 2000:
At December 31,
2001 2000
Carrying % of Carrying % of
Value Total Value Total
(Dollars in millions)
Fixed maturities available-for-sale, at fair value ***************************************** $115,398 68.0% $112,979 70.7%
Mortgage loans on real estate******************************************************* 23,621 13.9 21,951 13.7
Policy loans ********************************************************************** 8,272 4.9 8,158 5.1
Cash and cash equivalents ********************************************************* 7,473 4.4 3,434 2.1
Real estate and real estate joint ventures ********************************************* 5,730 3.4 5,504 3.4
Equity securities and other limited partnership interests ********************************** 4,700 2.8 3,845 2.4
Other invested assets ************************************************************* 3,298 1.9 2,821 1.8
Short-term investments ************************************************************ 1,203 0.7 1,269 0.8
Total cash and invested assets**************************************************** $169,695 100.0% $159,961 100.0%
Investment Results
The annual yields on general account cash and invested assets, excluding net investment gains and losses, were 7.56%, 7.54% and 7.27% for the
years ended December 31, 2001, 2000 and 1999, respectively.
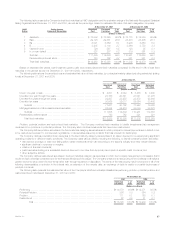
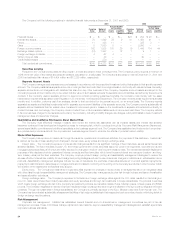
The following table illustrates the annual yields on average assets for each of the components of the Company’s investment portfolio for the years
ended December 31, 2001, 2000 and 1999:
2001 2000 1999
Yield(1) Amount Yield(1) Amount Yield(1) Amount
(Dollars in millions)
Fixed Maturities:(2)
Investment income ************************************************ 7.89% $ 8,574 7.81% $ 8,538 7.45% $ 7,171
Net investment losses ********************************************* (645) (1,437) (538)
Total ********************************************************** $ 7,929 $ 7,101 $ 6,633
Ending assets **************************************************** $115,398 $112,979 $96,981
Mortgage Loans:(3)
Investment income ************************************************ 8.17% $ 1,848 7.87% $ 1,693 8.14% $ 1,484
Net investment gains (losses) *************************************** (91) (18) 28
Total ********************************************************** $ 1,757 $ 1,675 $ 1,512
Ending assets **************************************************** $ 23,621 $21,951 $19,739
Policy Loans:
Investment income ************************************************ 6.56% $ 536 6.45% $ 515 6.13% 340
Ending assets **************************************************** $ 8,272 $ 8,158 $ 5,598
MetLife, Inc. 25