Lexmark 2015 Annual Report Download - page 96
Download and view the complete annual report
Please find page 96 of the 2015 Lexmark annual report below. You can navigate through the pages in the report by either clicking on the pages listed below, or by using the keyword search tool below to find specific information within the annual report.-
 1
1 -
2
-
3
-
4
-
5
-
6
-
7
-
8
-
9
-
10
-
11
-
12
-
13
-
14
-
15
-
16
-
17
-
18
-
19
-
20
-
21
-
22
-
23
-
24
-
25
-
26
-
27
-
28
-
29
-
30
-
31
-
32
-
33
-
34
-
35
-
36
-
37
-
38
-
39
-
40
-
41
-
42
-
43
-
44
-
45
-
46
-
47
-
48
-
49
-
50
-
51
-
52
-
53
-
54
-
55
-
56
-
57
-
58
-
59
-
60
-
61
-
62
-
63
-
64
-
65
-
66
-
67
-
68
-
69
-
70
-
71
-
72
-
73
-
74
-
75
-
76
-
77
-
78
-
79
-
80
-
81
-
82
-
83
-
84
-
85
-
 86
86 -
 87
87 -
 88
88 -
 89
89 -
 90
90 -
 91
91 -
 92
92 -
 93
93 -
 94
94 -
 95
95 -
 96
96 -
 97
97 -
 98
98 -
 99
99 -
 100
100 -
 101
101 -
 102
102 -
 103
103 -
 104
104 -
 105
105 -
 106
106 -
107
-
108
-
109
-
110
-
111
-
112
-
113
-
114
-
115
-
116
-
117
-
118
-
119
-
120
-
121
-
122
-
123
-
124
-
125
-
126
-
127
-
128
-
129
-
130
-
131
-
132
-
133
-
134
-
135
-
136
-
137
-
138
-
139
-
140
-
141
 |
 |

92
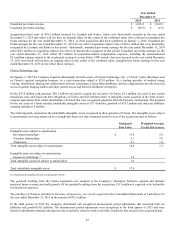
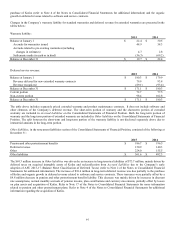
During 2013, a certain number of executive officers of the Company were also granted additional RSU awards having a performance
condition, which could range from 30,225 RSUs to 241,800 RSUs depending on the level of achievement. The performance measure
selected to indicate the level of achievement was return on invested capital compared to the S&P 500 Technology Index. The
performance period for the award is 3 years and ended on December 31, 2015. The expense for these awards is recognized at target
level.
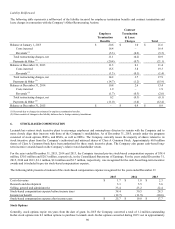
A summary of the status of the Company’s RSU and DSU grants as of December 31, 2015 and the changes during the year is
presented below:
Weighted
Weighted
Average
Average
Grant Date
Remaining
Aggregate
Units
Fair Value
Contractual Life
Intrinsic Value
(In Millions)
(Per Share)
(Years)
(In Millions)
RSUs and DSUs at December 31, 2014
2.6
$
32.81
1.4
$
108.5
Granted
2.4
42.52
Vested
(1.0)
35.26
Forfeited or canceled
(0.3)
37.90
RSUs and DSUs at December 31, 2015
3.7
$
39.22
1.4
$
120.6
For the year ended December 31, 2015, the total fair value of RSUs and DSUs that vested was $41.5 million. As of December 31,
2015, the Company had $18.7 million of total unrecognized compensation expense, net of estimated forfeitures, related to RSUs and
DSUs that will be recognized over the weighted average period of 1.6 years.
7. MARKETABLE SECURITIES
The Company liquidated its marketable securities portfolio entirely in the second quarter of 2015 in order to partially fund the
acquisition of Kofax. Refer to Note 4 for more information on the acquisition of Kofax.
The Company evaluates its marketable securities in accordance with authoritative guidance on accounting for investments in debt and
equity securities, and has determined that all of its investments in marketable securities should be classified as available-for-sale and
reported at fair value, with unrealized gains and losses recorded in Accumulated other comprehensive loss on the Consolidated
Statements of Financial Position. The fair values of the Company’s available-for-sale marketable securities may be based on quoted
market prices or other observable market data, discounted cash flow analyses, or in some cases, the Company’s amortized cost, which
approximates fair value.
Money market funds included in Cash and cash equivalents on the Consolidated Statements of Financial Position are excluded from
the information contained in this Note. Refer to Note 3 of the Notes to Consolidated Financial Statements for information regarding
these investments.
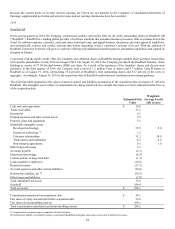
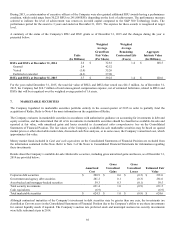
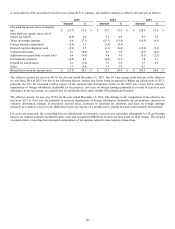
Details about the Company’s available-for-sale Marketable securities, including gross unrealized gains and losses, as of December 31,
2014 are provided below:
Gross
Gross
Amortized
Unrealized
Unrealized
Estimated Fair
Cost
Gains
Losses
Value
Corporate debt securities
$
290.9
$
0.6
$
(0.5)
$
291.0
Government and agency debt securities
281.2
0.1
(0.3)
281.0
Asset-backed and mortgage-backed securities
59.3
0.3
(0.1)
59.5
Total security investments
631.4
1.0
(0.9)
631.5
Cash equivalents
(6.9)
–
–
(6.9)
Total marketable securities
$
624.5
$
1.0
$
(0.9)
$
624.6
Although contractual maturities of the Company’s investment in debt securities may be greater than one year, the investments are
classified as Current assets in the Consolidated Statements of Financial Position due to the Company’s ability to use these investments
for current liquidity needs if required. The Company’s auction rate preferred stock and municipal auction rate security investments
were fully redeemed at par in 2014.