Lexmark 2015 Annual Report Download - page 48
Download and view the complete annual report
Please find page 48 of the 2015 Lexmark annual report below. You can navigate through the pages in the report by either clicking on the pages listed below, or by using the keyword search tool below to find specific information within the annual report.-
 1
1 -
2
-
3
-
4
-
5
-
6
-
7
-
8
-
9
-
10
-
11
-
12
-
13
-
14
-
15
-
16
-
17
-
18
-
19
-
20
-
21
-
22
-
23
-
24
-
25
-
26
-
27
-
28
-
29
-
30
-
31
-
32
-
33
-
34
-
35
-
36
-
37
-
 38
38 -
 39
39 -
 40
40 -
 41
41 -
 42
42 -
 43
43 -
 44
44 -
 45
45 -
 46
46 -
 47
47 -
 48
48 -
 49
49 -
 50
50 -
 51
51 -
 52
52 -
 53
53 -
 54
54 -
 55
55 -
 56
56 -
 57
57 -
 58
58 -
59
-
60
-
61
-
62
-
63
-
64
-
65
-
66
-
67
-
68
-
69
-
70
-
71
-
72
-
73
-
74
-
75
-
76
-
77
-
78
-
79
-
80
-
81
-
82
-
83
-
84
-
85
-
86
-
87
-
88
-
89
-
90
-
91
-
92
-
93
-
94
-
95
-
96
-
97
-
98
-
99
-
100
-
101
-
102
-
103
-
104
-
105
-
106
-
107
-
108
-
109
-
110
-
111
-
112
-
113
-
114
-
115
-
116
-
117
-
118
-
119
-
120
-
121
-
122
-
123
-
124
-
125
-
126
-
127
-
128
-
129
-
130
-
131
-
132
-
133
-
134
-
135
-
136
-
137
-
138
-
139
-
140
-
141
 |
 |

44
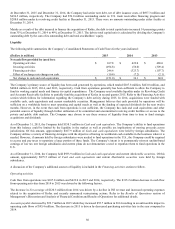
because the credit was retroactively extended to include 2012, the Company recognized the full benefit of the 2012 credit in the first
quarter of 2013 effectively including two years of rate benefit within the 2013 effective income tax rate.
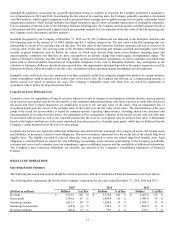
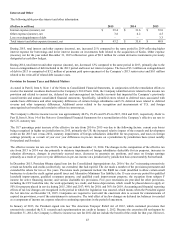
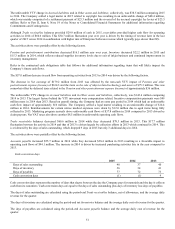
Net Earnings and Earnings per Share
The following table summarizes net (loss) earnings and basic and diluted net (loss) earnings per share:
(Dollars in millions, except per share amounts)
2015
2014
2013
Net (loss) earnings
$
(40.4)
$
79.9
$
259.1
Basic (loss) earnings per share
$
(0.66)
$
1.29
$
4.11
Diluted (loss) earnings per share
$
(0.66)
$
1.26
$
4.04
Net earnings for the year ended December 31, 2015 declined 151% from the prior year primarily due to lower operating income. For
2015, the YTY decrease in basic and diluted earnings per share was primarily due to lower net earnings, partially offset by a reduction
in weighted-average shares outstanding.
Net earnings for the year ended December 31, 2014 declined 69% from the prior year primarily due to lower operating income. For
2014, the YTY decrease in basic and diluted earnings per share was primarily due to lower net earnings, partially offset by a reduction
in weighted-average shares outstanding, due to the Company’s share repurchases.
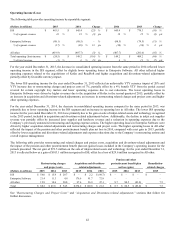
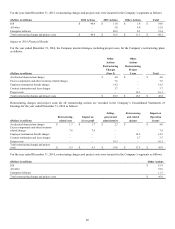
RESTRUCTURING CHARGES AND PROJECT COSTS
Summary of Restructuring Impacts
The Company’s 2015 financial results are impacted by its restructuring plans and related projects. Project costs consist of additional
charges related to the execution of the restructuring plans. These project costs are incremental to the Company’s normal operating
charges and are expensed as incurred, and include such items as compensation costs for overlap staffing, travel expenses, consulting
costs and training costs.
Summary of Restructuring Actions
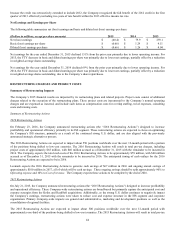
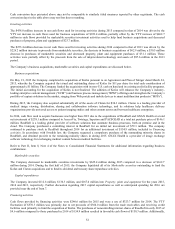
2016 Restructuring Actions
On February 23, 2016, the Company announced restructuring actions (the “2016 Restructuring Actions”) designed to increase
profitability and operational efficiency primarily in its ISS segment. These restructuring actions are expected to focus on optimizing
the Company’s ISS structure, primarily as a result of the continued strong U.S. dollar, and are also aligned with the previously
announced strategic alternatives process.
The 2016 Restructuring Actions are expected to impact about 550 positions worldwide over the next 12-month period with a portion
of the positions being shifted to low-cost countries. The 2016 Restructuring Actions will result in total pre-tax charges, including
project costs of approximately $65 million, with $40 million accrued as of December 31, 2015 with the remainder to be incurred in
2016. The Company expects the total cash costs of the 2016 Restructuring Actions to be approximately $59 million, with $40 million
accrued as of December 31, 2015 with the remainder to be incurred in 2016. The anticipated timing of cash outlays for the 2016
Restructuring Actions are expected to be in 2016.
Lexmark expects the 2016 Restructuring Actions to generate cash savings of $67 million in 2016 and ongoing annual savings of
approximately $100 million in 2017, all of which will be cash savings. These ongoing savings should be split approximately 90% to
Operating expense and 10% to Cost of revenue. The Company expects these actions to be complete by the end of 2016.
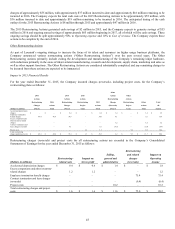
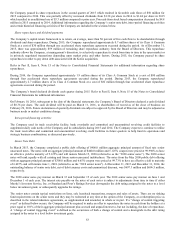
2015 Restructuring Actions
On July 21, 2015, the Company announced restructuring actions (the “2015 Restructuring Actions”) designed to increase profitability
and operational efficiency. These Company-wide restructuring actions are broad-based but primarily capture the anticipated cost and
expense synergies from the Kofax and ReadSoft acquisitions. Additionally, as the strong U.S. dollar continues to negatively impact
the Company’s earnings, restructuring actions were taken to reduce cost and expense structure in the ISS segment and corporate
organization. Primary Company-wide impacts are general and administrative, marketing and development positions as well as the
consolidation of regional facilities.
The 2015 Restructuring Actions are expected to impact about 500 positions worldwide over the next 12-month period with
approximately one-third of the positions being shifted to low-cost countries. The 2015 Restructuring Actions will result in total pre-tax