Lexmark 2015 Annual Report Download - page 54
Download and view the complete annual report
Please find page 54 of the 2015 Lexmark annual report below. You can navigate through the pages in the report by either clicking on the pages listed below, or by using the keyword search tool below to find specific information within the annual report.-
 1
1 -
2
-
3
-
4
-
5
-
6
-
7
-
8
-
9
-
10
-
11
-
12
-
13
-
14
-
15
-
16
-
17
-
18
-
19
-
20
-
21
-
22
-
23
-
24
-
25
-
26
-
27
-
28
-
29
-
30
-
31
-
32
-
33
-
34
-
35
-
36
-
37
-
38
-
39
-
40
-
41
-
42
-
43
-
 44
44 -
 45
45 -
 46
46 -
 47
47 -
 48
48 -
 49
49 -
 50
50 -
 51
51 -
 52
52 -
 53
53 -
 54
54 -
 55
55 -
 56
56 -
 57
57 -
 58
58 -
 59
59 -
 60
60 -
 61
61 -
 62
62 -
 63
63 -
 64
64 -
65
-
66
-
67
-
68
-
69
-
70
-
71
-
72
-
73
-
74
-
75
-
76
-
77
-
78
-
79
-
80
-
81
-
82
-
83
-
84
-
85
-
86
-
87
-
88
-
89
-
90
-
91
-
92
-
93
-
94
-
95
-
96
-
97
-
98
-
99
-
100
-
101
-
102
-
103
-
104
-
105
-
106
-
107
-
108
-
109
-
110
-
111
-
112
-
113
-
114
-
115
-
116
-
117
-
118
-
119
-
120
-
121
-
122
-
123
-
124
-
125
-
126
-
127
-
128
-
129
-
130
-
131
-
132
-
133
-
134
-
135
-
136
-
137
-
138
-
139
-
140
-
141
 |
 |

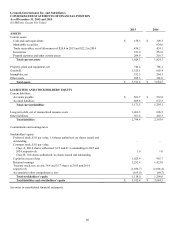
50
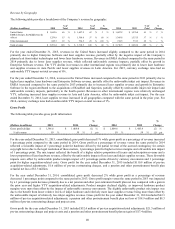
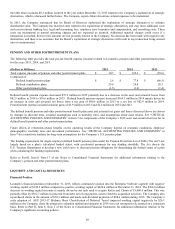
At December 31, 2015 and December 31, 2014, the Company had senior note debt, net of debt issuance costs, of $697.3 million and
$696.5 million, respectively. The Company had $76.0 million outstanding under its U.S. trade receivables financing program and
$288.0 million under its revolving credit facility at December 31, 2015. There were no amounts outstanding under either facility at
December 31, 2014.
Mainly as a result of the debt incurred to finance the acquisition of Kofax, the debt to total capital ratio increased 14 percentage points
from 35% at December 31, 2014 to 49% at December 31, 2015. The debt to total capital ratio is calculated by dividing the Company’s
outstanding debt by the sum of its outstanding debt and total stockholders’ equity.
Liquidity
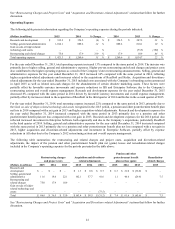
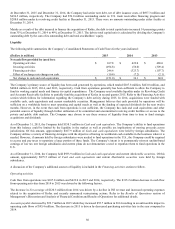
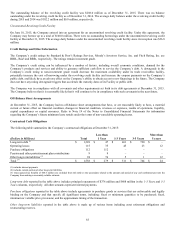
The following table summarizes the Company’s Consolidated Statements of Cash Flows for the years indicated:
(Dollars in millions)
2015
2014
2013
Net cash flow provided by (used for):
Operating activities
$
107.8
$
423.0
$
480.0
Investing activities
(494.8)
(56.0)
(309.4)
Financing activities
246.6
(323.7)
(107.7)
Effect of exchange rate changes on cash
(10.6)
(7.2)
(2.1)
Net change in cash and cash equivalents
$
(151.0)
$
36.1
$
60.8
The Company’s primary source of liquidity has been cash generated by operations, which totaled $107.8 million, $423.0 million, and
$480.0 million in 2015, 2014, and 2013, respectively. Cash from operations generally has been sufficient to allow the Company to
fund its working capital needs and finance its capital expenditures. The Company used available liquidity under its Revolving Credit
and Accounts Receivable facilities to partially fund the acquisition of Kofax in second quarter 2015. Refer to the Financing Activities
section which follows for information regarding the Company’s debt activity during 2015. In 2014, acquisitions were funded with
available cash, cash equivalents and current marketable securities. Management believes that cash provided by operations will be
sufficient on a worldwide basis to meet operating and capital needs as well as the funding of expected dividends for the next twelve
months. However, in the event that cash from operations is not sufficient, the Company has cash and cash equivalents and other
potential sources of liquidity through further utilization of its committed and uncommitted revolving credit facilities or access to the
private and public debt markets. The Company may choose to use these sources of liquidity from time to time to fund strategic
acquisitions and dividends.
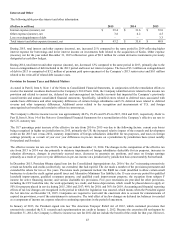
As of December 31, 2015, the Company held $158.3 million in Cash and cash equivalents. The Company’s ability to fund operations
from this balance could be limited by the liquidity in the market as well as possible tax implications of moving proceeds across
jurisdictions. Of this amount, approximately $107.9 million of Cash and cash equivalents were held by foreign subsidiaries. The
Company utilizes a variety of financing strategies with the objective of having its worldwide cash available in the locations where it is
needed. However, if amounts held by foreign subsidiaries were needed to fund operations in the U.S., the Company could be required
to accrue and pay taxes to repatriate a large portion of these funds. The Company’s intent is to permanently reinvest undistributed
earnings of low tax rate foreign subsidiaries and current plans do not demonstrate a need to repatriate them to fund operations in the
U.S.
As of December 31, 2014, the Company held $933.9 million in Cash and cash equivalents and current Marketable securities. Of this
amount, approximately $875.5 million of Cash and cash equivalents and current Marketable securities were held by foreign
subsidiaries.
A discussion of the Company’s additional sources of liquidity is included in the Financing activities section to follow.
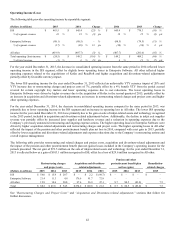
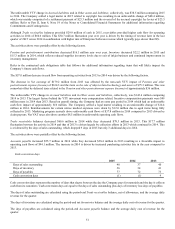
Operating activities
Cash flow from operations was $107.8 million and $423.0 in 2015 and 2014, respectively. The $315.2 million decrease in cash flow
from operating activities from 2014 to 2015 was driven by the following factors.
The decrease in Net earnings of $120.3 million from 2014 was driven by a decline in ISS revenue and increased operating expenses
related to the acquisition of Kofax and recently announced restructuring actions. Refer to the Results of Operations section of
Management’s Discussion and Analysis of Financial Condition and Results of Operations for additional details.
Accounts payable decreased by $39.7 million in 2015 while they increased $55.7 million in 2014 resulting in an unfavorable impact to
operating cash flows of $95.4 million. The decrease in 2015 is driven by decreased purchasing activities late in the year compared to
2014.