Lexmark 2015 Annual Report Download - page 2
Download and view the complete annual report
Please find page 2 of the 2015 Lexmark annual report below. You can navigate through the pages in the report by either clicking on the pages listed below, or by using the keyword search tool below to find specific information within the annual report.-
 1
1 -
 2
2 -
 3
3 -
 4
4 -
 5
5 -
 6
6 -
 7
7 -
 8
8 -
 9
9 -
 10
10 -
 11
11 -
 12
12 -
 13
13 -
14
-
15
-
16
-
17
-
18
-
19
-
20
-
21
-
22
-
23
-
24
-
25
-
26
-
27
-
28
-
29
-
30
-
31
-
32
-
33
-
34
-
35
-
36
-
37
-
38
-
39
-
40
-
41
-
42
-
43
-
44
-
45
-
46
-
47
-
48
-
49
-
50
-
51
-
52
-
53
-
54
-
55
-
56
-
57
-
58
-
59
-
60
-
61
-
62
-
63
-
64
-
65
-
66
-
67
-
68
-
69
-
70
-
71
-
72
-
73
-
74
-
75
-
76
-
77
-
78
-
79
-
80
-
81
-
82
-
83
-
84
-
85
-
86
-
87
-
88
-
89
-
90
-
91
-
92
-
93
-
94
-
95
-
96
-
97
-
98
-
99
-
100
-
101
-
102
-
103
-
104
-
105
-
106
-
107
-
108
-
109
-
110
-
111
-
112
-
113
-
114
-
115
-
116
-
117
-
118
-
119
-
120
-
121
-
122
-
123
-
124
-
125
-
126
-
127
-
128
-
129
-
130
-
131
-
132
-
133
-
134
-
135
-
136
-
137
-
138
-
139
-
140
-
141
 |
 |
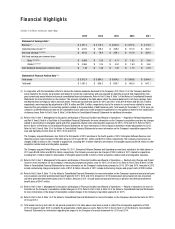
Financial Highlights
(1) In conjunction with the remediation efforts to resolve the material weakness disclosed in the Company’s 2014 Form 10-K, the Company identified
errors related to the income tax provision and related to current tax, deferred tax and unrecognized tax benefits accounts that impacted the Com-
pany’s previously issued interim and annual consolidated financial statements. Refer to Part II, Item 8, Note 1 of the Notes to Consolidated Financial
Statements for more information on the revision. The amounts included in the table above reflect the revised balances for net (loss) earnings, basic
and diluted (loss) earnings per share and total assets. Previously reported total assets for 2013 and 2012 of $3,616.9 million and $3,525.3 million,
respectively, were impacted by adjustments of $47.6 million and $44.5 million, respectively, due to the revision to correct errors related to income
taxes and the early adoption of accounting guidance related to the presentation of debt issuance costs. Total assets for December 31, 2015 were cal-
culated on a different basis and may not be comparable to prior years due to the prospective application of new guidance related to the classification
of deferred taxes. Refer to Part II, Item 8, Note 2 of the Notes to Consolidated Financial Statements for additional information.
(2) Refer to Part II, Item 7, Management’s Discussion and Analysis of Financial Condition and Results of Operations — Acquisition-Related Adjustments
and Part II, Item 8, Note 4 of the Notes to Consolidated Financial Statements for more information on the Company’s acquisitions and pre-tax charges
related to amortization of intangible assets and other acquisition-related costs and integration expenses for 2015, 2014 and 2013. Refer to Part II,
Item 8, Note 4 of the Notes to Consolidated Financial Statements for more information on the Company’s divestiture-related adjustments for 2013.
Refer to Part II, Item 8, Note 20 of the Notes to Consolidated Financial Statements for more information on the Company’s reportable segment Rev-
enue and Operating income (loss) for 2015, 2014 and 2013.
The Company acquired Brainware, Isys, Nolij in the first quarter of 2012 and Acuo in the fourth quarter of 2012. Enterprise Software Revenue and
Operating income (loss) included in the table above for 2012 were $156.1 million and $(72.0) million, respectively. The Company incurred pre-tax
charges of $60.3 million in 2012 related to acquisitions, including $41.4 million related to amortization of intangible assets and $18.9 million of other
acquisition-related costs and integration expenses.
The Company acquired Pallas Athena on October 18, 2011. Enterprise Software Revenue and Operating income (loss) included in the table above for
2011 were $94.8 million and $(29.5) million, respectively. The Company incurred pre-tax charges of $24.5 million in 2011 related to acquisitions,
including $21.2 million related to amortization of intangible assets and $3.3 million of other acquisition-related costs and integration expenses.
(3) Refer to Part II, Item 7, Management’s Discussion and Analysis of Financial Condition and Results of Operations — Restructuring Charges and Project
Costs for more information on the Company’s restructuring charges and project costs for 2015, 2014 and 2013. Refer to Part II, Item 8, Note 5 of the
Notes to Consolidated Financial Statements for more information on the Company’s restructuring charges for 2015, 2014 and 2013. Amounts in 2012
include restructuring charges and project costs of $121.8 million. Amounts in 2011 include restructuring charges and project costs of $29.9 million.
(4) Refer to Part II, Item 8, Note 17 of the Notes to Consolidated Financial Statements for more information on the Company’s asset and actuarial net gain/
loss on pension and other postretirement benefit plans for 2015, 2014 and 2013. Amounts in 2012 include asset and actuarial net loss on pension
and other postretirement benefit plans of $21.8 million. Amounts in 2011 include asset and actuarial net loss on pension and other postretirement
benefit plans of $94.7 million.
(5) Refer to Part II, Item 7, Management’s Discussion and Analysis of Financial Condition and Results of Operations — Results of Operations for more in-
formation on the Company’s remediation-related charges for 2015. Refer to Part II, Item 8, Note 20 of the Notes to Consolidated Financial Statements
for more information on the impact of remediation-related charges to the Company’s reportable segments for 2015.
(6) Refer to Part II, Item 8, Note 14 of the Notes to Consolidated Financial Statements for more information on the Company’s discrete tax items for 2015,
2014 and 2013.
(7) Total assets and long-term debt for all periods presented in the table above have been revised to reflect the retrospective application of ASU
2015-03 issued in April 2015 to simplify the presentation of debt issuance costs. Refer to Part II, Item 8, Note 13 of the Notes to Consolidated
Financial Statements for information regarding the impact to the Company’s financial statements for 2015 and 2014.
2015 2014 2013 2012 2011
Statement of Earnings Data(1):
Revenue (2) $ 3,551.2 $ 3,710.5 $ 3,667.6 $ 3,797.6 $ 4,173.0
Operating (loss) income (2)(3) $ (24.5) $ 149.2 $ 409.2 $ 191.5 $ 367.7
Net (loss) earnings (2)(3)(4)(5)(6) $ (40.4) $ 79.9 $ 259.1 $ 110.9 $ 280.9
Net (loss) earnings per common share:
Basic (2)(3)(4)(5)(6) $ (0.66) $ 1.29 $ 4.11 $ 1.62 $ 3.64
Diluted (2)(3)(4)(5)(6) $ (0.66) $ 1.26 $ 4.04 $ 1.60 $ 3.60
Cash dividends declared per common share $ 1.44 $ 1.38 $ 1.20 $ 1.15 $ 0.25
Statement of Financial Position Data(1)(7):
Total assets $ 3,912.4 $ 3,684.5 $ 3,664.5 $ 3,569.8 $ 3,644.4
Total debt $ 1,061.3 $ 696.5 $ 695.7 $ 648.0 $ 647.1
(Dollars in millions, except per share data)