Lexmark 2015 Annual Report Download - page 56
Download and view the complete annual report
Please find page 56 of the 2015 Lexmark annual report below. You can navigate through the pages in the report by either clicking on the pages listed below, or by using the keyword search tool below to find specific information within the annual report.-
 1
1 -
2
-
3
-
4
-
5
-
6
-
7
-
8
-
9
-
10
-
11
-
12
-
13
-
14
-
15
-
16
-
17
-
18
-
19
-
20
-
21
-
22
-
23
-
24
-
25
-
26
-
27
-
28
-
29
-
30
-
31
-
32
-
33
-
34
-
35
-
36
-
37
-
38
-
39
-
40
-
41
-
42
-
43
-
44
-
45
-
 46
46 -
 47
47 -
 48
48 -
 49
49 -
 50
50 -
 51
51 -
 52
52 -
 53
53 -
 54
54 -
 55
55 -
 56
56 -
 57
57 -
 58
58 -
 59
59 -
 60
60 -
 61
61 -
 62
62 -
 63
63 -
 64
64 -
 65
65 -
 66
66 -
67
-
68
-
69
-
70
-
71
-
72
-
73
-
74
-
75
-
76
-
77
-
78
-
79
-
80
-
81
-
82
-
83
-
84
-
85
-
86
-
87
-
88
-
89
-
90
-
91
-
92
-
93
-
94
-
95
-
96
-
97
-
98
-
99
-
100
-
101
-
102
-
103
-
104
-
105
-
106
-
107
-
108
-
109
-
110
-
111
-
112
-
113
-
114
-
115
-
116
-
117
-
118
-
119
-
120
-
121
-
122
-
123
-
124
-
125
-
126
-
127
-
128
-
129
-
130
-
131
-
132
-
133
-
134
-
135
-
136
-
137
-
138
-
139
-
140
-
141
 |
 |
52
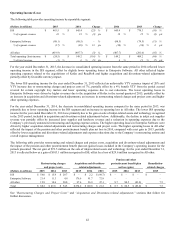
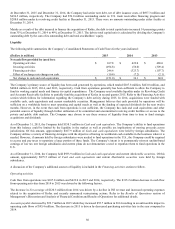
Cash conversion days presented above may not be comparable to similarly titled measures reported by other registrants. The cash
conversion days in the table above may not foot due to rounding.
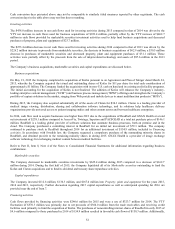
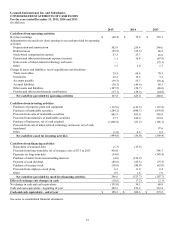
Investing activities
The $438.8 million increase in net cash flows used for investing activities during 2015 compared to that of 2014 was driven by the
YTY net increase in cash flows used for business acquisitions of $923.4 million, partially offset by the YTY increase of $462.7
million in cash flows provided by marketable securities investment activities used to help fund business acquisitions and decreased
purchases of property, plant and equipment of $23.7 million.
The $253.4 million decrease in net cash flows used for investing activities during 2014 compared to that of 2013 was driven by the
$226.2 million increase in proceeds from marketable securities, the decrease in business acquisitions of $62.9 million, a $30.5 million
decrease in purchases of marketable securities and decreased property, plant and equipment purchases of $31.1 million. These
activities were partially offset by the proceeds from the sale of inkjet-related technology and assets of $97.6 million in the 2013
period.
The Company’s business acquisitions, marketable securities and capital expenditures are discussed below.
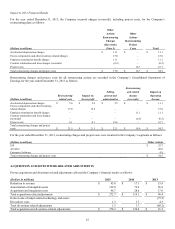
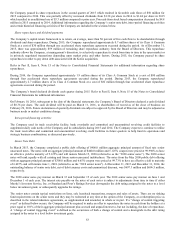
Business acquisitions
On May 21, 2015 the Company completed its acquisition of Kofax pursuant to an Agreement and Plan of Merger dated March 24,
2015, whereby the Company acquired the issued and outstanding shares of Kofax for $11 per share for total cash consideration of
approximately $1 billion. The Company funded the acquisition with its non-U.S. cash on hand and its existing credit facility programs.
The initial accounting for the acquisition of Kofax is not finalized. The addition of Kofax will enhance the Company’s industry-
leading enterprise content management (“ECM”) and business process management (“BPM”) offerings and strengthen the Company’s
portfolio of capture solutions in the market, ranging from Web portals and mobile devices to smart multifunction products (“MFPs”).
During 2015, the Company also acquired substantially all of the assets of Claron for $30.3 million. Claron is a leading provider of
medical image viewing, distribution, sharing and collaboration software technology, and its solutions help healthcare delivery
organizations provide universal access to patient imaging studies and other content across and between healthcare enterprises.
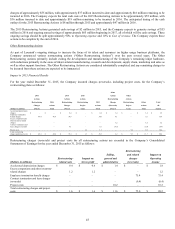
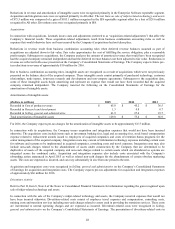
In 2014, cash flow used to acquire businesses was higher than 2013 due to the acquisitions of ReadSoft and GNAX Health at a total
net investment of $238.1 million compared to AccessVia, Twistage, Saperion and PACSGEAR at a total net purchase price of $146.1
million. ReadSoft is a leading global provider of software solutions that automate business processes, both on premise and in the
cloud. The Company purchased a controlling interest in ReadSoft for an initial net investment of $79.3 million. The company
continued to purchase stock in ReadSoft throughout 2014 for an additional investment of $154.9 million, included in Financing
activities. In accordance with Swedish law, the Company requested a compulsory purchase of the outstanding minority shares in
ReadSoft, and obtained pre-title to the remaining minority shares in during 2015. GNAX Health is a provider of image exchange
software technology for exchanging medical content between medical facilities.
Refer to Part II, Item 8, Note 4 of the Notes to Consolidated Financial Statements for additional information regarding business
combinations.
Marketable securities
The Company decreased its marketable securities investments by $625.4 million during 2015 compared to a decrease of $162.7
million during 2014. During the first half of 2015, the Company liquidated all of its Marketable securities outstanding to fund the
Kofax and Claron acquisitions and to fund its dividend and treasury share repurchase activities.
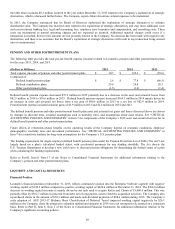
Capital expenditures
The Company invested $112.6 million, $136.3 million, and $167.4 million into Property, plant and equipment for the years 2015,
2014 and 2013, respectively. Further discussion regarding 2015 capital expenditures as well as anticipated spending for 2016 are
provided near the end of Item 7.
Financing activities
Cash flows provided by financing activities were $246.6 million for 2015 and were a use of $323.7 million for 2014. The YTY
fluctuation of $570.3 million was primarily due to net proceeds of $364.0 million from the trade receivables and revolving credit
facilities used primarily to fund the acquisition of Kofax. The purchases of noncontrolling interest shares of ReadSoft in early 2015 of
$4.6 million compared to those purchased in 2014 of $154.9 million resulted in favorable cash flows of $150.3 million. Additionally,