Lexmark 2015 Annual Report Download - page 46
Download and view the complete annual report
Please find page 46 of the 2015 Lexmark annual report below. You can navigate through the pages in the report by either clicking on the pages listed below, or by using the keyword search tool below to find specific information within the annual report.-
 1
1 -
2
-
3
-
4
-
5
-
6
-
7
-
8
-
9
-
10
-
11
-
12
-
13
-
14
-
15
-
16
-
17
-
18
-
19
-
20
-
21
-
22
-
23
-
24
-
25
-
26
-
27
-
28
-
29
-
30
-
31
-
32
-
33
-
34
-
35
-
 36
36 -
 37
37 -
 38
38 -
 39
39 -
 40
40 -
 41
41 -
 42
42 -
 43
43 -
 44
44 -
 45
45 -
 46
46 -
 47
47 -
 48
48 -
 49
49 -
 50
50 -
 51
51 -
 52
52 -
 53
53 -
 54
54 -
 55
55 -
 56
56 -
57
-
58
-
59
-
60
-
61
-
62
-
63
-
64
-
65
-
66
-
67
-
68
-
69
-
70
-
71
-
72
-
73
-
74
-
75
-
76
-
77
-
78
-
79
-
80
-
81
-
82
-
83
-
84
-
85
-
86
-
87
-
88
-
89
-
90
-
91
-
92
-
93
-
94
-
95
-
96
-
97
-
98
-
99
-
100
-
101
-
102
-
103
-
104
-
105
-
106
-
107
-
108
-
109
-
110
-
111
-
112
-
113
-
114
-
115
-
116
-
117
-
118
-
119
-
120
-
121
-
122
-
123
-
124
-
125
-
126
-
127
-
128
-
129
-
130
-
131
-
132
-
133
-
134
-
135
-
136
-
137
-
138
-
139
-
140
-
141
 |
 |

42
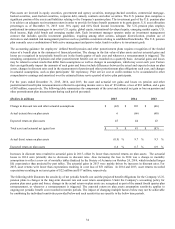
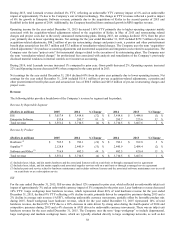
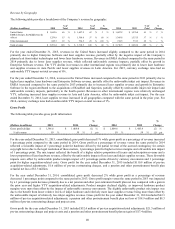
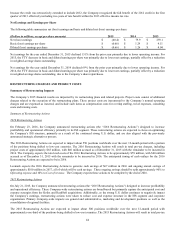
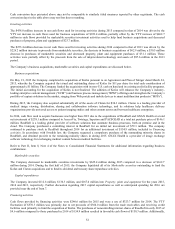
Operating Income (Loss)
The following table provides operating income by reportable segment:
(Dollars in millions)
2015
2014
Change
2014
2013
Change
ISS
$
483.5
$
645.4
(25)
%
$
645.4
$
770.3
(16)
%
% of segment revenue
16
%
19
%
(3)
pts
19
%
22
%
(3)
pts
Enterprise Software
(88.1)
(88.5)
–
%
(88.5)
(79.5)
(11)
%
% of segment revenue
(17)
%
(30)
%
13
pts
(30)
%
(36)
%
6
pts
All other
(419.9)
(407.7)
(3)
%
(407.7)
(281.6)
(45)
%
Total operating (loss) income
$
(24.5)
$
149.2
(116)
%
$
149.2
$
409.2
(64)
%
% of total revenue
(1)
%
4
%
(5)
pts
4
%
11
%
(7)
pts
For the year ended December 31, 2015, the decrease in consolidated operating income from the same period in 2014 reflected lower
operating income in the ISS segment, offset by slightly lower operating losses in Enterprise Software. All other reflected higher
operating expenses related to the acquisitions of Kofax and ReadSoft and higher acquisition and divestiture-related adjustments
partially offset by favorable currency impact.
The lower ISS operating income for the year ended December 31, 2015 reflected an unfavorable YTY currency impact of 20% and
YTY increase due to restructuring charges and project costs of 7%, partially offset by a 4% benefit YTY from the partial accrual
reversal for certain copyright levy matters and lower operating expenses due to cost reductions. The lower operating losses in
Enterprise Software were driven by higher revenues due to the acquisition of Kofax in the second quarter of 2015, partially offset by
an increase in acquisition and divestiture-related adjustments, an increase in restructuring related charges and project costs and higher
other operating expenses.
For the year ended December 31, 2014, the decrease in consolidated operating income compared to the same period in 2013, was
primarily due to lower operating income in the ISS segment and an increase in operating loss in All other. The lower ISS operating
income for the year ended December 31, 2014 was primarily due to the gain on sale of inkjet-related assets and technology recognized
in the 2013 period, included in acquisition and divestiture-related adjustments below. Additionally, the decline in inkjet exit supplies
revenue was partially offset by increased laser supplies and hardware revenue and a reduction in operating expenses due to the
Company’s previously announced restructuring and ongoing expense actions. The higher operating losses in Enterprise Software were
driven by higher acquisition-related adjustments and restructuring charges and project costs. The higher operating losses in All other
reflected the impact of the pension and other postretirement benefit plan net loss in 2014, compared with a net gain in 2013, partially
offset by lower acquisition and divestiture-related adjustments and expense reductions due to the Company’s restructuring actions and
overall expense management.
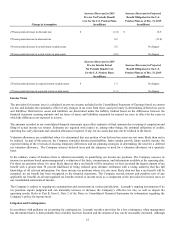
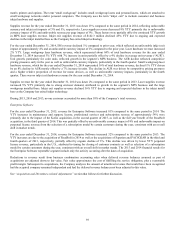
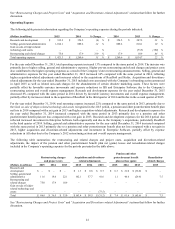
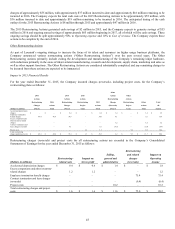
The following table provides restructuring and related charges and project costs, acquisition and divestiture-related adjustments and
the impact of the pension and other postretirement benefit plan net (gains) losses included in the Company’s operating income for the
periods presented. The net gain of $73.5 million on the sale of inkjet-related assets and technology for the year ended December 31,
2013 is reflected below as a gain of $103.1 million recognized in ISS, offset by a loss of $29.6 million recognized in All other.
Pension and other
Restructuring charges
Acquisition and divestiture-
postretirement benefit plan
Remediation-
and project costs
related adjustments
net loss (gain)
related charges
(Dollars in millions)
2015
2014
2013
2015
2014
2013
2015
2014
2013
2015
ISS
$
54.0
$
15.9
$
29.7
$
–
$
2.2
$
(98.7)
$
–
$
–
$
–
$
–
Enterprise Software
21.4
11.3
4.8
176.6
91.7
72.8
–
–
–
–
All other
12.8
18.6
20.0
97.6
26.9
47.1
8.7
80.5
(83.0)
7.5
Total
$
88.2
$
45.8
$
54.5
$
274.2
$
120.8
$
21.2
$
8.7
$
80.5
$
(83.0)
$
7.5
See “Restructuring Charges and Project Costs” and “Acquisition and Divestiture-related Adjustments” sections that follow for
further discussion.