Lexmark 2015 Annual Report Download - page 116
Download and view the complete annual report
Please find page 116 of the 2015 Lexmark annual report below. You can navigate through the pages in the report by either clicking on the pages listed below, or by using the keyword search tool below to find specific information within the annual report.-
 1
1 -
2
-
3
-
4
-
5
-
6
-
7
-
8
-
9
-
10
-
11
-
12
-
13
-
14
-
15
-
16
-
17
-
18
-
19
-
20
-
21
-
22
-
23
-
24
-
25
-
26
-
27
-
28
-
29
-
30
-
31
-
32
-
33
-
34
-
35
-
36
-
37
-
38
-
39
-
40
-
41
-
42
-
43
-
44
-
45
-
46
-
47
-
48
-
49
-
50
-
51
-
52
-
53
-
54
-
55
-
56
-
57
-
58
-
59
-
60
-
61
-
62
-
63
-
64
-
65
-
66
-
67
-
68
-
69
-
70
-
71
-
72
-
73
-
74
-
75
-
76
-
77
-
78
-
79
-
80
-
81
-
82
-
83
-
84
-
85
-
86
-
87
-
88
-
89
-
90
-
91
-
92
-
93
-
94
-
95
-
96
-
97
-
98
-
99
-
100
-
101
-
102
-
103
-
104
-
105
-
 106
106 -
 107
107 -
 108
108 -
 109
109 -
 110
110 -
 111
111 -
 112
112 -
 113
113 -
 114
114 -
 115
115 -
 116
116 -
 117
117 -
 118
118 -
 119
119 -
 120
120 -
 121
121 -
 122
122 -
 123
123 -
 124
124 -
 125
125 -
 126
126 -
127
-
128
-
129
-
130
-
131
-
132
-
133
-
134
-
135
-
136
-
137
-
138
-
139
-
140
-
141
 |
 |

112
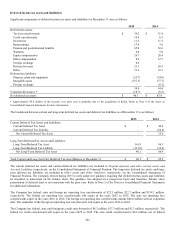
assessment of variability in pricing by comparison to independent source(s) of pricing, and
back-testing of transactions to determine historical accuracy of net asset value per share/unit as an exit price.
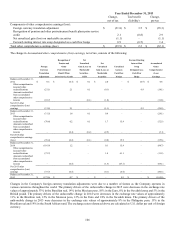
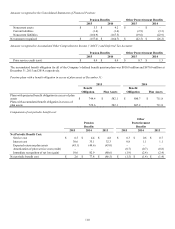
The following is a description of the valuation methodologies used for pension assets measured at fair value. Refer to Note 3 of the
Notes to Consolidated Financial Statements for details on the accounting framework for measuring fair value and the related fair value
hierarchy.
Commingled trust funds: Valued at the net asset value per unit at year end as quoted by the funds.
Fixed income: Valued at quoted prices, broker dealer quotations, or other methods by which all significant inputs are generally
observable, either directly or indirectly. If significant inputs are unobservable, the security is classified as Level 3.
Cash equivalent: Valued at the per share (unit) published as the basis for current transactions.
Insurance contract: Valued at the surrender value or conversion value.
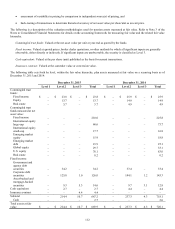
The following table sets forth by level, within the fair value hierarchy, plan assets measured at fair value on a recurring basis as of
December 31, 2015 and 2014:
December 31, 2015
December 31, 2014
Level 1
Level 2
Level 3
Total
Level 1
Level 2
Level 3
Total
Commingled trust
funds:
Fixed income
$
–
$
23.8
$
–
$
23.8
$
–
$
25.9
$
–
$
25.9
Equity
–
13.7
–
13.7
–
14.9
–
14.9
Real estate
–
5.7
–
5.7
–
4.9
–
4.9
Commingled trust
funds measured at net
asset value:
Fixed income
–
–
–
210.0
–
–
–
225.8
International equity
large-cap
–
–
–
68.6
–
–
–
73.7
International equity
small-cap
–
–
–
17.7
–
–
–
16.8
Emerging market
equity
–
–
–
15.9
–
–
–
18.8
Emerging market
debt
–
–
–
23.9
–
–
–
25.1
Global equity
–
–
–
29.7
–
–
–
33.1
U.S. equity
–
–
–
76.1
–
–
–
83.0
Real estate
–
–
–
0.2
–
–
–
0.2
Fixed income:
Government and
agency debt
securities
–
34.2
–
34.2
–
33.4
–
33.4
Corporate debt
securities
–
125.0
1.0
126.0
–
144.1
1.2
145.3
Asset-backed and
mortgage-backed
securities
–
9.3
5.3
14.6
–
9.7
3.1
12.8
Cash equivalent
–
2.7
–
2.7
–
4.4
–
4.4
Insurance contract
–
–
4.4
4.4
–
–
–
–
Subtotal
–
214.4
10.7
667.2
–
237.3
4.3
718.1
Cash
–
–
–
2.7
–
–
–
2.0
Total assets at fair
value
$
–
$
214.4
$
10.7
$
669.9
$
–
$
237.3
$
4.3
$
720.1