Lexmark 2015 Annual Report Download - page 95
Download and view the complete annual report
Please find page 95 of the 2015 Lexmark annual report below. You can navigate through the pages in the report by either clicking on the pages listed below, or by using the keyword search tool below to find specific information within the annual report.-
 1
1 -
2
-
3
-
4
-
5
-
6
-
7
-
8
-
9
-
10
-
11
-
12
-
13
-
14
-
15
-
16
-
17
-
18
-
19
-
20
-
21
-
22
-
23
-
24
-
25
-
26
-
27
-
28
-
29
-
30
-
31
-
32
-
33
-
34
-
35
-
36
-
37
-
38
-
39
-
40
-
41
-
42
-
43
-
44
-
45
-
46
-
47
-
48
-
49
-
50
-
51
-
52
-
53
-
54
-
55
-
56
-
57
-
58
-
59
-
60
-
61
-
62
-
63
-
64
-
65
-
66
-
67
-
68
-
69
-
70
-
71
-
72
-
73
-
74
-
75
-
76
-
77
-
78
-
79
-
80
-
81
-
82
-
83
-
84
-
 85
85 -
 86
86 -
 87
87 -
 88
88 -
 89
89 -
 90
90 -
 91
91 -
 92
92 -
 93
93 -
 94
94 -
 95
95 -
 96
96 -
 97
97 -
 98
98 -
 99
99 -
 100
100 -
 101
101 -
 102
102 -
 103
103 -
 104
104 -
 105
105 -
106
-
107
-
108
-
109
-
110
-
111
-
112
-
113
-
114
-
115
-
116
-
117
-
118
-
119
-
120
-
121
-
122
-
123
-
124
-
125
-
126
-
127
-
128
-
129
-
130
-
131
-
132
-
133
-
134
-
135
-
136
-
137
-
138
-
139
-
140
-
141
 |
 |

91
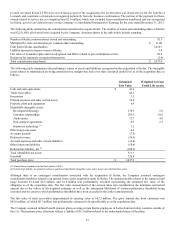
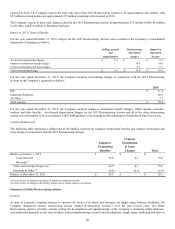
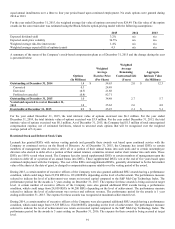
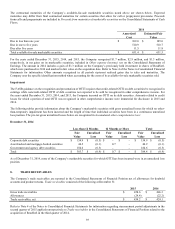
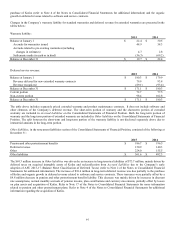
equal annual installments over a three to four year period based upon continued employment. No stock options were granted during
2014 or 2013.
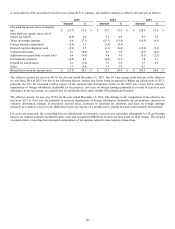
For the year ended December 31, 2015, the weighted average fair value of options converted were $24.49. The fair value of the option
awards on the conversion date was estimated using the Black-Scholes option-pricing model with the following assumptions:
2015
2014
2013
Expected dividend yield
3.2%
n/a
n/a
Expected stock price volatility
36.5%
n/a
n/a
Weighted average risk-free interest rate
1.4%
n/a
n/a
Weighted average expected life of options (years)
4.5
n/a
n/a
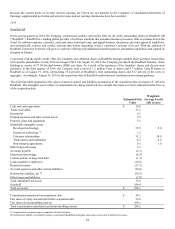
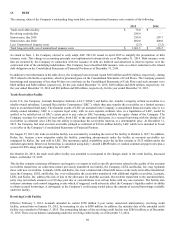
A summary of the status of the Company’s stock-based compensation plans as of December 31, 2015 and the change during the year
is presented below:
Weighted
Weighted
Average
Average
Remaining
Aggregate
Options
Exercise Price
Contractual Life
Intrinsic Value
(In Millions)
(Per Share)
(Years)
(In Millions)
Outstanding at December 31, 2014
1.8
$
54.63
2.0
$
12.3
Converted
0.3
24.49
Exercised
(0.3)
21.88
Forfeited or canceled
(0.8)
82.71
Outstanding at December 31, 2015
1.0
34.48
2.7
5.7
Vested and expected to vest at December 31,
2015
1.0
35.62
2.6
4.8
Exercisable at December 31, 2015
0.9
$
35.25
2.1
$
5.1
For the year ended December 31, 2015, the total intrinsic value of options exercised was $6.3 million. For the year ended
December 31, 2014, the total intrinsic value of options exercised was $3.9 million. For the year ended December 31, 2013, the total
intrinsic value of options exercised was $0.1 million. As of December 31, 2015, the Company had $1.3 million of total unrecognized
compensation expense, net of estimated forfeitures, related to unvested stock options that will be recognized over the weighted
average period of 3.4 years.
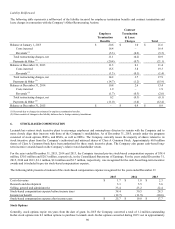
Restricted Stock and Deferred Stock Units
Lexmark has granted RSUs with various vesting periods and generally these awards vest based upon continued service with the
Company or continued service on the Board of Directors. As of December 31, 2015, the Company has issued DSUs to certain
members of management who elected to defer all or a portion of their annual bonus into such units and to certain nonemployee
directors who elected to defer all or a portion of their annual retainer, committee retainer and/or chair retainer into such units. These
DSUs are 100% vested when issued. The Company has also issued supplemental DSUs to certain members of management upon the
election to defer all or a portion of an annual bonus into DSUs. These supplemental DSUs vest at the end of five years based upon
continued employment with the Company. The cost of the RSUs and supplemental DSUs, generally determined to be the fair market
value of the shares at the date of grant, is charged to compensation expense ratably over the vesting period of the award.
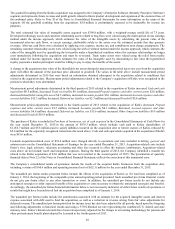
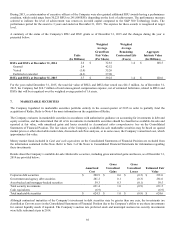
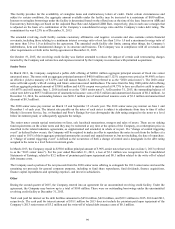
During 2015, a certain number of executive officers of the Company were also granted additional RSU awards having a performance
condition, which could range from 23,950 RSUs to 191,600 RSUs depending on the level of achievement. The performance measure
selected to indicate the level of achievement was return on invested capital compared to the S&P Mid-Cap Technology Index. The
performance period for the awards is 3 years ending on December 31, 2017. The expense for these awards is being accrued at target
level. A certain number of executive officers of the Company were also granted additional RSU awards having a performance
condition, which could range from 24,050 RSUs to 96,200 RSUs depending on the level of achievement. The performance measure
selected to indicate the level of achievement was services and software revenue. The performance period for the awards is 1 year
ending on December 31, 2015. The expense for these awards was recognized at maximum achievement level.
During 2014, a certain number of executive officers of the Company were also granted additional RSU awards having a performance
condition, which could range from 19,325 RSUs to 154,600 RSUs depending on the level of achievement. The performance measure
selected to indicate the level of achievement was return on invested capital compared to the S&P Mid-Cap Technology Index. The
performance period for the awards is 3 years ending on December 31, 2016. The expense for these awards is being accrued at target
level.