Lexmark 2015 Annual Report Download - page 126
Download and view the complete annual report
Please find page 126 of the 2015 Lexmark annual report below. You can navigate through the pages in the report by either clicking on the pages listed below, or by using the keyword search tool below to find specific information within the annual report.-
 1
1 -
2
-
3
-
4
-
5
-
6
-
7
-
8
-
9
-
10
-
11
-
12
-
13
-
14
-
15
-
16
-
17
-
18
-
19
-
20
-
21
-
22
-
23
-
24
-
25
-
26
-
27
-
28
-
29
-
30
-
31
-
32
-
33
-
34
-
35
-
36
-
37
-
38
-
39
-
40
-
41
-
42
-
43
-
44
-
45
-
46
-
47
-
48
-
49
-
50
-
51
-
52
-
53
-
54
-
55
-
56
-
57
-
58
-
59
-
60
-
61
-
62
-
63
-
64
-
65
-
66
-
67
-
68
-
69
-
70
-
71
-
72
-
73
-
74
-
75
-
76
-
77
-
78
-
79
-
80
-
81
-
82
-
83
-
84
-
85
-
86
-
87
-
88
-
89
-
90
-
91
-
92
-
93
-
94
-
95
-
96
-
97
-
98
-
99
-
100
-
101
-
102
-
103
-
104
-
105
-
106
-
107
-
108
-
109
-
110
-
111
-
112
-
113
-
114
-
115
-
 116
116 -
 117
117 -
 118
118 -
 119
119 -
 120
120 -
 121
121 -
 122
122 -
 123
123 -
 124
124 -
 125
125 -
 126
126 -
 127
127 -
 128
128 -
 129
129 -
 130
130 -
 131
131 -
 132
132 -
 133
133 -
 134
134 -
 135
135 -
 136
136 -
137
-
138
-
139
-
140
-
141
 |
 |

122
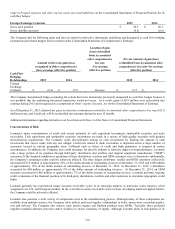
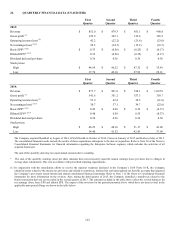
22. QUARTERLY FINANCIAL DATA (UNAUDITED)
First
Second
Third
Fourth
Quarter
Quarter
Quarter
Quarter
2015:
Revenue
$
852.0
$
879.3
$
851.1
$
968.8
Gross profit (2)
329.9
362.1
319.6
385.2
Operating income (loss) (2)
42.2
(22.2)
(21.6)
(23.0)
Net earnings (loss) (1)(2)
20.2
(34.7)
(15.2)
(10.7)
Basic EPS* (1)(2)
$
0.33
$
(0.56)
$
(0.25)
$
(0.17)
Diluted EPS* (1)(2)
0.32
(0.56)
(0.25)
(0.17)
Dividend declared per share
0.36
0.36
0.36
0.36
Stock prices:
High
$
44.95
$
46.22
$
47.32
$
35.43
Low
37.70
42.10
27.92
29.21
First
Second
Third
Fourth
Quarter
Quarter
Quarter
Quarter
2014:
Revenue
$
877.7
$
891.8
$
918.1
$
1,022.9
Gross profit (3)
341.6
351.2
357.3
359.7
Operating income (loss) (3)
53.9
62.4
54.5
(21.6)
Net earnings (loss) (1)(3)
30.7
37.1
34.7
(22.6)
Basic EPS* (1)(3)
$
0.49
$
0.60
$
0.56
$
(0.37)
Diluted EPS* (1)(3)
0.48
0.59
0.55
(0.37)
Dividend declared per share
0.30
0.36
0.36
0.36
Stock prices:
High
$
46.29
$
48.16
$
51.17
$
43.40
Low
34.40
41.52
42.43
37.99
The Company acquired ReadSoft in August of 2014, GNAX Health in October of 2014, Claron in January of 2015 and Kofax in May of 2015.
The consolidated financial results include the results of these acquisitions subsequent to the date of acquisition. Refer to Note 20 of the Notes to
Consolidated Financial Statements for financial information regarding the Enterprise Software segment, which includes the activities of all
acquired businesses.
The sum of the quarterly data may not equal annual amounts due to rounding.
* The sum of the quarterly earnings (loss) per share amounts does not necessarily equal the annual earnings (loss) per share due to changes in
average share calculations. This is in accordance with prescribed reporting requirements.
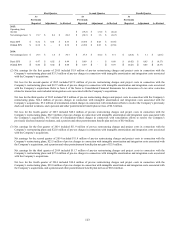
(1) In conjunction with the remediation efforts to resolve the material weakness disclosed in the Company’s 2014 Form 10-K, the Company
identified errors related to the income tax provision and related to current tax, deferred tax and unrecognized tax benefits accounts that impacted
the Company’s previously issued interim and annual consolidated financial statements. Refer to Note 1 of the Notes to Consolidated Financial
Statements for more information on the revision. Also, during the third quarter of 2015, the Company identified a transfer tax related to the
Kofax transaction that was not recorded in the second quarter of 2015. The amounts included in the table above reflect the revised balances for
net earnings (loss), basic EPS and diluted EPS. The impact of the revisions for the periods presented above which have not been revised in the
applicable prior period filings are shown in the table below: