Lexmark 2015 Annual Report Download - page 44
Download and view the complete annual report
Please find page 44 of the 2015 Lexmark annual report below. You can navigate through the pages in the report by either clicking on the pages listed below, or by using the keyword search tool below to find specific information within the annual report.-
 1
1 -
2
-
3
-
4
-
5
-
6
-
7
-
8
-
9
-
10
-
11
-
12
-
13
-
14
-
15
-
16
-
17
-
18
-
19
-
20
-
21
-
22
-
23
-
24
-
25
-
26
-
27
-
28
-
29
-
30
-
31
-
32
-
33
-
 34
34 -
 35
35 -
 36
36 -
 37
37 -
 38
38 -
 39
39 -
 40
40 -
 41
41 -
 42
42 -
 43
43 -
 44
44 -
 45
45 -
 46
46 -
 47
47 -
 48
48 -
 49
49 -
 50
50 -
 51
51 -
 52
52 -
 53
53 -
 54
54 -
55
-
56
-
57
-
58
-
59
-
60
-
61
-
62
-
63
-
64
-
65
-
66
-
67
-
68
-
69
-
70
-
71
-
72
-
73
-
74
-
75
-
76
-
77
-
78
-
79
-
80
-
81
-
82
-
83
-
84
-
85
-
86
-
87
-
88
-
89
-
90
-
91
-
92
-
93
-
94
-
95
-
96
-
97
-
98
-
99
-
100
-
101
-
102
-
103
-
104
-
105
-
106
-
107
-
108
-
109
-
110
-
111
-
112
-
113
-
114
-
115
-
116
-
117
-
118
-
119
-
120
-
121
-
122
-
123
-
124
-
125
-
126
-
127
-
128
-
129
-
130
-
131
-
132
-
133
-
134
-
135
-
136
-
137
-
138
-
139
-
140
-
141
 |
 |

40
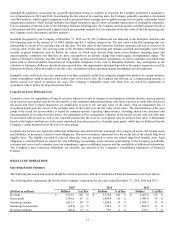
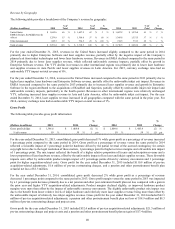
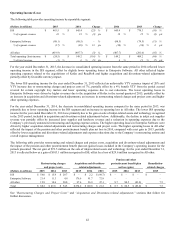
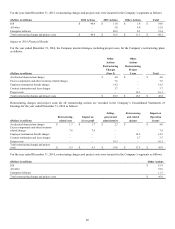
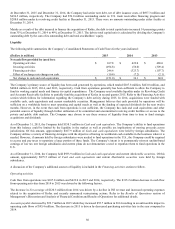
Revenue by Geography
The following table provides a breakdown of the Company’s revenue by geography:
(Dollars in millions)
2015
% of
Total
2014
% of
Total
%
Change
2014
2013
% of
Total
%
Change
United States
$
1,645.6
46
%
$
1,607.2
43
%
2
%
$
1,607.2
$
1,576.8
43
%
2
%
EMEA (Europe, the Middle East &
Africa)
1,259.9
35
%
1,368.8
37
%
(8)
%
1,368.8
1,353.5
37
%
1
%
Other International
645.7
19
%
734.5
20
%
(12)
%
734.5
737.3
20
%
–
%
Total revenue
$
3,551.2
100
%
$
3,710.5
100
%
(4)
%
$
3,710.5
$
3,667.6
100
%
1
%
For the year ended December 31, 2015, revenues in the United States increased slightly compared to the same period in 2014
primarily due to higher Enterprise Software and laser supplies revenue, partially offset by the negative impact of the Company’s
planned exit from inkjet technologies and lower laser hardware revenue. Revenues in EMEA declined compared to the same period in
2014 primarily due to lower laser supplies revenue, which reflected unfavorable currency impacts, partially offset by growth in
Enterprise Software revenue. The YTY decline in revenues in other international regions was primarily due to lower laser hardware
and supplies revenues in Asia Pacific and lower supplies revenues in Latin America. For 2015, currency exchange rates had an
unfavorable YTY impact on total revenue of 6%.
For the year ended December 31, 2014, revenues in the United States increased compared to the same period in 2013 primarily due to
higher laser supplies, laser hardware and Enterprise Software revenue, partially offset by unfavorable inkjet exit impact. Revenues in
EMEA increased compared to the same period in 2013 primarily due to increased laser supplies revenue and growth in Enterprise
Software in the region attributed to the acquisitions of ReadSoft and Saperion, partially offset by unfavorable inkjet exit impact and
unfavorable currency impacts, particularly in the fourth quarter. Revenues in other international regions were relatively unchanged
YTY, reflecting increased laser supplies revenue in Asia and Latin America, offset by unfavorable inkjet exit impact. For the year
ended December 31, 2014, laser supplies revenue increased in all geographies compared with the same period in the prior year. For
2014, currency exchange rates had an unfavorable YTY impact on total revenue of 1%.
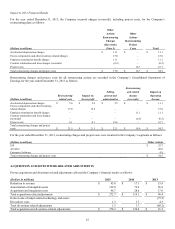
Gross Profit
The following table provides gross profit information:
%
%
(Dollars in millions)
2015
2014
Change
2014
2013
Change
Gross profit dollars
$
1,396.8
$
1,409.8
(1)
%
$
1,409.8
$
1,443.9
(2)
%
% of revenue
39
%
38
%
1
pts
38
%
39
%
(1)
pts
For the year ended December 31, 2015, consolidated gross profit decreased 1% while gross profit as a percentage of revenue increased
1 percentage point compared to the same period in 2014. Gross profit as a percentage of revenue versus the same period in 2014
reflected a favorable impact of 1 percentage point for hardware driven by the partial reversal of the accrued contingency for certain
copyright levies due to the legal resolution of these matters, 1 percentage point for higher services margins and a favorable mix impact
of 1 percentage point. The mix impact reflected the benefit of a higher relative proportion of license and subscription revenue and a
lower proportion of laser hardware revenue, offset by the unfavorable impact of less laser and inkjet supplies revenue. These favorable
impacts were offset by unfavorable product margin impact of 2 percentage points driven by currency movements and 1 percentage
point for higher acquisition-related costs. Gross profit for the year ended December 31, 2015 included $110.9 million of pre-tax
acquisition-related adjustments, $1.6 million of pre-tax restructuring charges, and a pension and other postretirement benefit plan
actuarial net loss of $1.3 million.
For the year ended December 31, 2014, consolidated gross profit decreased 2% while gross profit as a percentage of revenue
decreased 1 percentage point compared to the same period in 2013. Gross profit margin versus the same period in 2013 was impacted
by a 1 percentage point decrease primarily due to a net pension and other post-retirement benefit plan net loss compared with a gain in
the prior year and higher YTY acquisition-related adjustments. Product margins declined slightly, as improved hardware product
margins were more than offset by the impact of unfavorable currency movements. The slightly unfavorable product mix impact was
due to the benefit from lower relative levels of inkjet hardware and relatively more laser supplies revenue being more than offset by
the unfavorable impact of relatively less inkjet supplies revenue. Gross profit for the year ended December 31, 2014 included $62.3
million of pre-tax acquisition-related adjustments, a pension and other postretirement benefit plan net loss of $18.9 million and $9.3
million of pre-tax restructuring charges and project costs.
Gross profit for the year ended December 31, 2013 included $52.4 million of pre-tax acquisition-related adjustments, $21.5 million of
pre-tax restructuring charges and project costs and a pension and other postretirement benefit plan net gain of $17.4 million.