Lexmark 2015 Annual Report Download - page 65
Download and view the complete annual report
Please find page 65 of the 2015 Lexmark annual report below. You can navigate through the pages in the report by either clicking on the pages listed below, or by using the keyword search tool below to find specific information within the annual report.-
 1
1 -
2
-
3
-
4
-
5
-
6
-
7
-
8
-
9
-
10
-
11
-
12
-
13
-
14
-
15
-
16
-
17
-
18
-
19
-
20
-
21
-
22
-
23
-
24
-
25
-
26
-
27
-
28
-
29
-
30
-
31
-
32
-
33
-
34
-
35
-
36
-
37
-
38
-
39
-
40
-
41
-
42
-
43
-
44
-
45
-
46
-
47
-
48
-
49
-
50
-
51
-
52
-
53
-
54
-
 55
55 -
 56
56 -
 57
57 -
 58
58 -
 59
59 -
 60
60 -
 61
61 -
 62
62 -
 63
63 -
 64
64 -
 65
65 -
 66
66 -
 67
67 -
 68
68 -
 69
69 -
 70
70 -
 71
71 -
 72
72 -
 73
73 -
 74
74 -
 75
75 -
76
-
77
-
78
-
79
-
80
-
81
-
82
-
83
-
84
-
85
-
86
-
87
-
88
-
89
-
90
-
91
-
92
-
93
-
94
-
95
-
96
-
97
-
98
-
99
-
100
-
101
-
102
-
103
-
104
-
105
-
106
-
107
-
108
-
109
-
110
-
111
-
112
-
113
-
114
-
115
-
116
-
117
-
118
-
119
-
120
-
121
-
122
-
123
-
124
-
125
-
126
-
127
-
128
-
129
-
130
-
131
-
132
-
133
-
134
-
135
-
136
-
137
-
138
-
139
-
140
-
141
 |
 |

61
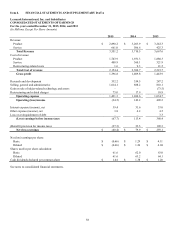
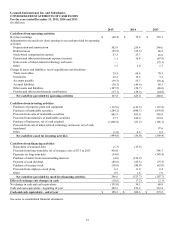
Lexmark International, Inc. and Subsidiaries
CONSOLIDATED STATEMENTS OF CASH FLOWS
For the years ended December 31, 2015, 2014 and 2013
(In Millions)
2015
2014
2013
Cash flows from operating activities:
Net (loss) earnings
$
(40.4)
$
79.9
$
259.1
Adjustments to reconcile net (loss) earnings to net cash provided by operating
activities:
Depreciation and amortization
302.9
259.4
249.6
Deferred taxes
(55.9)
(25.5)
40.5
Stock-based compensation expense
37.3
27.7
26.6
Pension and other postretirement expense (income)
1.1
76.4
(87.9)
Gain on sale of inkjet-related technology and assets
–
–
(75.3)
Other
1.3
2.0
1.7
Change in assets and liabilities, net of acquisitions and divestiture:
Trade receivables
29.9
60.6
78.3
Inventories
22.2
15.3
7.3
Accounts payable
(39.7)
55.7
(38.4)
Accrued liabilities
(30.3)
(44.6)
89.3
Other assets and liabilities
(107.5)
(54.7)
(46.0)
Pension and other postretirement contributions
(13.1)
(29.2)
(24.8)
Net cash flows provided by operating activities
107.8
423.0
480.0
Cash flows from investing activities:
Purchases of property, plant and equipment
(112.6)
(136.3)
(167.4)
Purchases of marketable securities
(284.2)
(848.3)
(878.8)
Proceeds from sales of marketable securities
881.9
851.0
565.8
Proceeds from maturities of marketable securities
27.7
160.0
219.0
Purchase of businesses, net of cash acquired
(1,006.6)
(83.2)
(146.1)
Proceeds from sale of inkjet-related technology and assets, net of cash
transferred
–
–
97.6
Other
(1.0)
0.8
0.5
Net cash flows used for investing activities
(494.8)
(56.0)
(309.4)
Cash flows from financing activities:
Repayment of assumed debt
(1.3)
(15.9)
–
Proceeds from long-term debt, net of issuance costs of $3.3 in 2013
418.0
–
396.7
Payments on long-term debt
(54.0)
–
(349.4)
Purchase of shares from noncontrolling interests
(4.6)
(154.9)
–
Payment of cash dividend
(88.6)
(85.3)
(75.3)
Purchase of treasury stock
(30.0)
(80.0)
(82.0)
Proceeds from employee stock plans
6.2
11.0
0.4
Other
0.9
1.4
1.9
Net cash flows provided by (used for) financing activities
246.6
(323.7)
(107.7)
Effect of exchange rate changes on cash
(10.6)
(7.2)
(2.1)
Net change in cash and cash equivalents
(151.0)
36.1
60.8
Cash and cash equivalents - beginning of year
309.3
273.2
212.4
Cash and cash equivalents - end of year
$
158.3
$
309.3
$
273.2
See notes to consolidated financial statements.