Lexmark 2015 Annual Report Download - page 115
Download and view the complete annual report
Please find page 115 of the 2015 Lexmark annual report below. You can navigate through the pages in the report by either clicking on the pages listed below, or by using the keyword search tool below to find specific information within the annual report.-
 1
1 -
2
-
3
-
4
-
5
-
6
-
7
-
8
-
9
-
10
-
11
-
12
-
13
-
14
-
15
-
16
-
17
-
18
-
19
-
20
-
21
-
22
-
23
-
24
-
25
-
26
-
27
-
28
-
29
-
30
-
31
-
32
-
33
-
34
-
35
-
36
-
37
-
38
-
39
-
40
-
41
-
42
-
43
-
44
-
45
-
46
-
47
-
48
-
49
-
50
-
51
-
52
-
53
-
54
-
55
-
56
-
57
-
58
-
59
-
60
-
61
-
62
-
63
-
64
-
65
-
66
-
67
-
68
-
69
-
70
-
71
-
72
-
73
-
74
-
75
-
76
-
77
-
78
-
79
-
80
-
81
-
82
-
83
-
84
-
85
-
86
-
87
-
88
-
89
-
90
-
91
-
92
-
93
-
94
-
95
-
96
-
97
-
98
-
99
-
100
-
101
-
102
-
103
-
104
-
 105
105 -
 106
106 -
 107
107 -
 108
108 -
 109
109 -
 110
110 -
 111
111 -
 112
112 -
 113
113 -
 114
114 -
 115
115 -
 116
116 -
 117
117 -
 118
118 -
 119
119 -
 120
120 -
 121
121 -
 122
122 -
 123
123 -
 124
124 -
 125
125 -
126
-
127
-
128
-
129
-
130
-
131
-
132
-
133
-
134
-
135
-
136
-
137
-
138
-
139
-
140
-
141
 |
 |

111
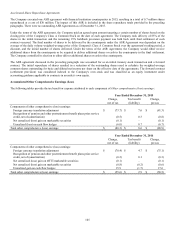
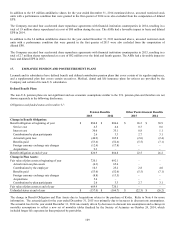
Other changes in plan assets and benefit obligations recognized in AOCI (pre-tax) for the years ended December 31:
2015
2014
2013
Other
Other
Other
Pension
Postretirement
Pension
Postretirement
Pension
Postretirement
Benefits
Benefits
Total
Benefits
Benefits
Total
Benefits
Benefits
Total
New prior service
(credit) cost
$
–
$
–
$
–
$
–
$
–
$
–
$
(0.7)
$
(2.7)
$
(3.4)
Amortization or
curtailment
recognition of
prior service
credit (cost)
–
0.7
0.7
–
0.7
0.7
–
0.8
0.8
Total amount
recognized in
AOCI for the
period
–
0.7
0.7
–
0.7
0.7
(0.7)
(1.9)
(2.6)
Net periodic
benefit cost
2.6
(1.5)
1.1
77.8
(1.4)
76.4
(86.5)
(1.4)
(87.9)
Total amount
recognized in net
periodic benefit
cost and AOCI for
the period
$
2.6
$
(0.8)
$
1.8
$
77.8
$
(0.7)
$
77.1
$
(87.2)
$
(3.3)
$
(90.5)
The estimated prior service credit for the other defined benefit postretirement plan that will be amortized from Accumulated other
comprehensive earnings (loss) into net periodic benefit cost over the next fiscal year is $0.7 million.
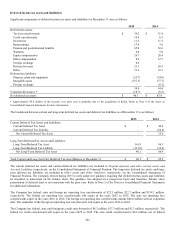
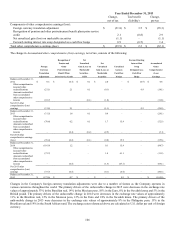
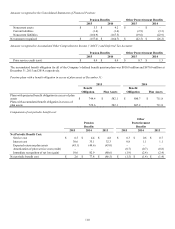
Assumptions:
Pension Benefits
Other Postretirement Benefits
2015
2014
2015
2014
Weighted-Average Assumptions Used to Determine
Benefit Obligations at December 31:
Discount rate
4.0
%
3.7
%
3.7
%
3.3
%
Rate of compensation increase
3.5
%
3.5
%
–
–
Pension Benefits
Other Postretirement Benefits
2015
2014
2013
2015
2014
2013
Weighted-Average Assumptions Used to
Determine Net Periodic Benefit Cost for
Years Ended December 31:
Discount rate
3.7
%
4.6
%
3.9
%
3.3
%
3.9
%
3.5
%
Expected long-term return on plan assets
6.6
%
6.7
%
6.9
%
–
–
–
Rate of compensation increase
3.5
%
3.0
%
3.1
%
–
–
–
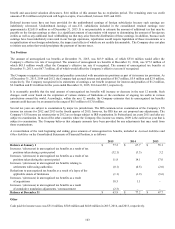
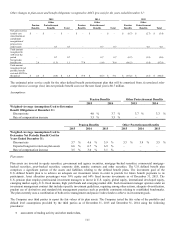
Plan assets:
Plan assets are invested in equity securities, government and agency securities, mortgage-backed securities, commercial mortgage-
backed securities, asset-backed securities, corporate debt, annuity contracts and other securities. The U.S. defined benefit plan
comprises a significant portion of the assets and liabilities relating to the defined benefit plans. The investment goal of the
U.S. defined benefit plan is to achieve an adequate net investment return in order to provide for future benefit payments to its
participants. Asset allocation percentages were 36% equity and 64% fixed income investments as of December 31, 2015. The
U.S. pension plan employs professional investment managers to invest in U.S. equity, global equity, international developed equity,
emerging market equity, U.S. fixed income, high yield bonds and emerging market debt. Each investment manager operates under an
investment management contract that includes specific investment guidelines, requiring among other actions, adequate diversification,
prudent use of derivatives and standard risk management practices such as portfolio constraints relating to established benchmarks.
The plan currently uses a combination of both active management and passive index funds to achieve its investment goals.
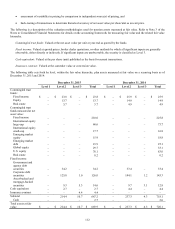
The Company uses third parties to report the fair values of its plan assets. The Company tested the fair value of the portfolio and
default level assumptions provided by the third parties as of December 31, 2015 and December 31, 2014 using the following
procedures:
assessment of trading activity and other market data,