Lexmark 2015 Annual Report Download - page 41
Download and view the complete annual report
Please find page 41 of the 2015 Lexmark annual report below. You can navigate through the pages in the report by either clicking on the pages listed below, or by using the keyword search tool below to find specific information within the annual report.-
 1
1 -
2
-
3
-
4
-
5
-
6
-
7
-
8
-
9
-
10
-
11
-
12
-
13
-
14
-
15
-
16
-
17
-
18
-
19
-
20
-
21
-
22
-
23
-
24
-
25
-
26
-
27
-
28
-
29
-
30
-
 31
31 -
 32
32 -
 33
33 -
 34
34 -
 35
35 -
 36
36 -
 37
37 -
 38
38 -
 39
39 -
 40
40 -
 41
41 -
 42
42 -
 43
43 -
 44
44 -
 45
45 -
 46
46 -
 47
47 -
 48
48 -
 49
49 -
 50
50 -
 51
51 -
52
-
53
-
54
-
55
-
56
-
57
-
58
-
59
-
60
-
61
-
62
-
63
-
64
-
65
-
66
-
67
-
68
-
69
-
70
-
71
-
72
-
73
-
74
-
75
-
76
-
77
-
78
-
79
-
80
-
81
-
82
-
83
-
84
-
85
-
86
-
87
-
88
-
89
-
90
-
91
-
92
-
93
-
94
-
95
-
96
-
97
-
98
-
99
-
100
-
101
-
102
-
103
-
104
-
105
-
106
-
107
-
108
-
109
-
110
-
111
-
112
-
113
-
114
-
115
-
116
-
117
-
118
-
119
-
120
-
121
-
122
-
123
-
124
-
125
-
126
-
127
-
128
-
129
-
130
-
131
-
132
-
133
-
134
-
135
-
136
-
137
-
138
-
139
-
140
-
141
 |
 |

37
Although the qualitative assessment for goodwill impairment testing is available to Lexmark, the Company performed a quantitative
test of impairment in 2015 and 2014. In estimating the fair value of its reporting units, the Company generally considers a discounted
cash flow analysis, which requires judgments such as projected future earnings and weighted average cost of capital, and market based
measurement analysis, which include multiples developed from prices paid in observed market transactions of comparable companies.
For its estimation of the fair value of the Enterprise Software reporting unit, the Company used an equally-weighted measure based on
a discounted cash flow analysis and a market based measurement analysis. For its estimation of the fair value of the ISS reporting unit,
the Company used a discounted cash flow analysis.
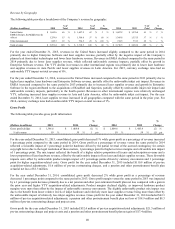
Goodwill recognized by the Company at December 31, 2015 was $1,325.1 million and was allocated to the Enterprise Software and
ISS reporting units in the amount of $1,308.6 million and $16.5 million, respectively. The fair value of the ISS reporting unit was
substantially in excess of its carrying value on this date. The fair value of the Enterprise Software reporting unit was in excess of its
carrying value on this date. The carrying value of the Enterprise Software reporting unit includes goodwill and intangible assets from
recently acquired businesses such as Kofax, the values of which were derived from more recent business operating plans and
macroeconomic conditions and therefore are more susceptible to an adverse change that could require an impairment charge. The
values of Enterprise Software and ISS were heavily reliant on forecasted financial information, as well as multiples developed from
prices paid in observed market transactions of comparable companies in the case of Enterprise Software. Key assumptions to the
valuation of Enterprise Software include revenue growth rates that approximate anticipated growth in the market segments served by
Enterprise Software. Other key inputs to the fair value calculations include operating margin assumptions and discount rates.
Intangible assets with finite lives are amortized over their estimated useful lives using the straight-line method. In certain instances
where consumption could be greater in the earlier years of the asset’s life, the Company has selected, as a compensating measure, a
shorter period over which to amortize the asset. The Company’s intangible assets with finite lives are tested for impairment in
accordance with its policy for long-lived assets below.
Long-Lived Assets Held and Used
Lexmark reviews for impairment of long-lived assets whenever events or changes in circumstances indicate that the carrying amount
of an asset (or asset group) may not be recoverable. If the estimated undiscounted future cash flows expected to result from the use of
the assets and their eventual disposition are insufficient to recover the carrying value of the assets, then an impairment loss is
recognized based upon the excess of the carrying value of the assets over the fair value of the assets. The determination of the asset
group to be tested for recoverability is based on company-specific operating characteristics, including shared cost structures and
interdependency of revenues between assets. An impairment review incorporates estimates of forecasted revenue and costs that may
be associated with an asset as well as the expected periods that the asset (or asset group) may be utilized. Fair value is determined
based on the highest and best use of the assets considered from the perspective of market participants, which may be different than the
Company’s actual intended use of the asset (or asset group).
Lexmark also reviews any legal and contractual obligations associated with the retirement of its long-lived assets and records assets
and liabilities, as necessary, related to such obligations. The asset recorded is amortized over the useful life of the related long-lived
tangible asset. The liability recorded is relieved when the costs are incurred to retire the related long-lived tangible asset. Each
obligation is estimated based on current law and technology; accordingly, such estimates could change as the Company periodically
evaluates and revises such estimates based on expenditures against established reserves and the availability of additional information.
The Company’s asset retirement obligations are currently not material to the Company’s Consolidated Statements of Financial
Position.
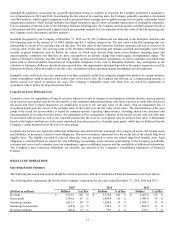
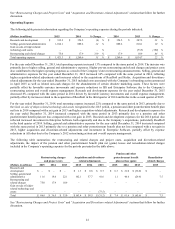
RESULTS OF OPERATIONS
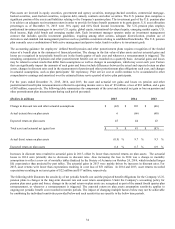
Operating Results Summary
The following discussion and analysis should be read in conjunction with the Consolidated Financial Statements and Notes thereto.
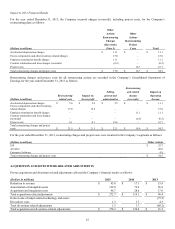
The following table summarizes the results of the Company’s operations for the years ended December 31, 2015, 2014 and 2013:
2015
2014
2013
(Dollars in millions)
Dollars
% of Rev
Dollars
% of Rev
Dollars
% of Rev
Revenue
$
3,551.2
100
%
$
3,710.5
100
%
$
3,667.6
100
%
Gross profit
1,396.8
39
%
1,409.8
38
%
1,443.9
39
%
Operating expense
1,421.3
40
%
1,260.6
34
%
1,034.7
28
%
Operating (loss) income
(24.5)
(1)
%
149.2
4
%
409.2
11
%
Net (loss) earnings
(40.4)
(1)
%
79.9
2
%
259.1
7
%