Lexmark 2015 Annual Report Download - page 117
Download and view the complete annual report
Please find page 117 of the 2015 Lexmark annual report below. You can navigate through the pages in the report by either clicking on the pages listed below, or by using the keyword search tool below to find specific information within the annual report.-
 1
1 -
2
-
3
-
4
-
5
-
6
-
7
-
8
-
9
-
10
-
11
-
12
-
13
-
14
-
15
-
16
-
17
-
18
-
19
-
20
-
21
-
22
-
23
-
24
-
25
-
26
-
27
-
28
-
29
-
30
-
31
-
32
-
33
-
34
-
35
-
36
-
37
-
38
-
39
-
40
-
41
-
42
-
43
-
44
-
45
-
46
-
47
-
48
-
49
-
50
-
51
-
52
-
53
-
54
-
55
-
56
-
57
-
58
-
59
-
60
-
61
-
62
-
63
-
64
-
65
-
66
-
67
-
68
-
69
-
70
-
71
-
72
-
73
-
74
-
75
-
76
-
77
-
78
-
79
-
80
-
81
-
82
-
83
-
84
-
85
-
86
-
87
-
88
-
89
-
90
-
91
-
92
-
93
-
94
-
95
-
96
-
97
-
98
-
99
-
100
-
101
-
102
-
103
-
104
-
105
-
106
-
 107
107 -
 108
108 -
 109
109 -
 110
110 -
 111
111 -
 112
112 -
 113
113 -
 114
114 -
 115
115 -
 116
116 -
 117
117 -
 118
118 -
 119
119 -
 120
120 -
 121
121 -
 122
122 -
 123
123 -
 124
124 -
 125
125 -
 126
126 -
 127
127 -
128
-
129
-
130
-
131
-
132
-
133
-
134
-
135
-
136
-
137
-
138
-
139
-
140
-
141
 |
 |

113
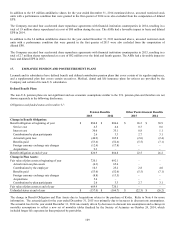
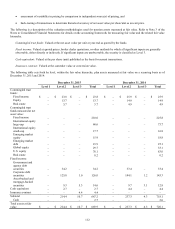
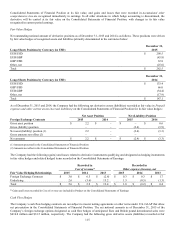
In accordance with recently updated accounting standards, certain investments in 2015 and 2014 that are measured at fair value using
the net asset value per share (or its equivalent) practical expedient have not been classified as Level 1, 2 or 3 in the above fair value
hierarchy but are included in the Total. Refer to Note 2 of the Notes to Consolidated Financial Statements for additional information.
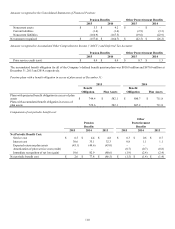
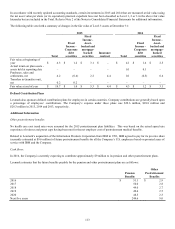
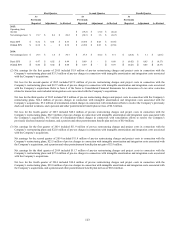
The following table sets forth a summary of changes in the fair value of Level 3 assets at December 31:
2015
2014
Total
Fixed
Income -
Corporate
debt
securities
Fixed
Income -
Asset-
backed and
mortgage-
backed
securities
Insurance
contract
Total
Fixed
Income -
Corporate
debt
securities
Fixed
Income -
Asset-
backed and
mortgage-
backed
securities
Fair value at beginning of
year
$
4.3
$
1.2
$
3.1
$
–
$
4.1
$
1.6
$
2.5
Actual return on plan assets -
assets held at reporting date
–
–
–
–
0.1
0.1
–
Purchases, sales and
settlements, net
6.2
(0.4)
2.2
4.4
0.1
(0.5)
0.6
Transfers in/(transfers out),
net
0.2
0.2
–
–
–
–
–
Fair value at end of year
$
10.7
$
1.0
$
5.3
$
4.4
$
4.3
$
1.2
$
3.1
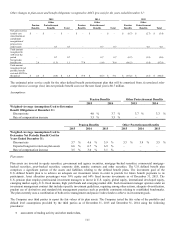
Defined Contribution Plans
Lexmark also sponsors defined contribution plans for employees in certain countries. Company contributions are generally based upon
a percentage of employees’ contributions. The Company’s expense under these plans was $29.6 million, $28.8 million and
$28.3 million in 2015, 2014 and 2013, respectively.
Additional Information
Other postretirement benefits:
No health care cost trend rates were assumed for the 2015 postretirement plan liabilities. This was based on the actual spend rate
experience of retirees and preset caps having been met for the net employer cost of postretirement medical benefits.
Related to Lexmark’s acquisition of the Information Products Corporation from IBM in 1991, IBM agreed to pay for its pro rata share
(currently estimated at $9.6 million) of future postretirement benefits for all the Company’s U.S. employees based on prorated years of
service with IBM and the Company.
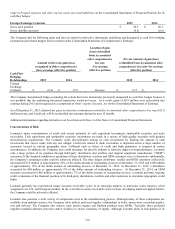
Cash flows:
In 2016, the Company is currently expecting to contribute approximately $9 million to its pension and other postretirement plans.
Lexmark estimates that the future benefits payable for the pension and other postretirement plans are as follows:
Other
Pension
Postretirement
Benefits
Benefits
2016
$
51.1
$
2.9
2017
50.0
2.8
2018
49.0
2.7
2019
49.6
2.5
2020
48.5
2.3
Next five years
244.6
9.0