Lexmark 2015 Annual Report Download - page 66
Download and view the complete annual report
Please find page 66 of the 2015 Lexmark annual report below. You can navigate through the pages in the report by either clicking on the pages listed below, or by using the keyword search tool below to find specific information within the annual report.-
 1
1 -
2
-
3
-
4
-
5
-
6
-
7
-
8
-
9
-
10
-
11
-
12
-
13
-
14
-
15
-
16
-
17
-
18
-
19
-
20
-
21
-
22
-
23
-
24
-
25
-
26
-
27
-
28
-
29
-
30
-
31
-
32
-
33
-
34
-
35
-
36
-
37
-
38
-
39
-
40
-
41
-
42
-
43
-
44
-
45
-
46
-
47
-
48
-
49
-
50
-
51
-
52
-
53
-
54
-
55
-
 56
56 -
 57
57 -
 58
58 -
 59
59 -
 60
60 -
 61
61 -
 62
62 -
 63
63 -
 64
64 -
 65
65 -
 66
66 -
 67
67 -
 68
68 -
 69
69 -
 70
70 -
 71
71 -
 72
72 -
 73
73 -
 74
74 -
 75
75 -
 76
76 -
77
-
78
-
79
-
80
-
81
-
82
-
83
-
84
-
85
-
86
-
87
-
88
-
89
-
90
-
91
-
92
-
93
-
94
-
95
-
96
-
97
-
98
-
99
-
100
-
101
-
102
-
103
-
104
-
105
-
106
-
107
-
108
-
109
-
110
-
111
-
112
-
113
-
114
-
115
-
116
-
117
-
118
-
119
-
120
-
121
-
122
-
123
-
124
-
125
-
126
-
127
-
128
-
129
-
130
-
131
-
132
-
133
-
134
-
135
-
136
-
137
-
138
-
139
-
140
-
141
 |
 |

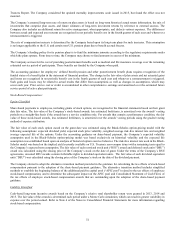
62
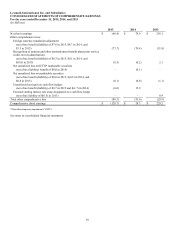
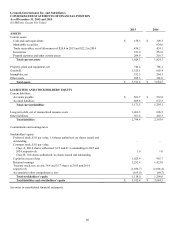
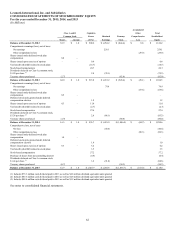
Lexmark International, Inc. and Subsidiaries
CONSOLIDATED STATEMENTS OF STOCKHOLDERS’ EQUITY
For the years ended December 31, 2015, 2014, and 2013
(In Millions)
Accumulated
Class A and B
Capital in
Other
Total
Common Stock
Excess
Retained
Treasury
Comprehensive
Stockholders'
Shares
Amount
of Par
Earnings
Stock
Loss
Equity
Balance at December 31, 2012
63.9
$
1.0
$
900.6
$
1,252.2
$
(844.4)
$
0.8
$
1,310.2
Comprehensive earnings (loss), net of taxes
Net earnings
259.1
259.1
Other comprehensive loss
(29.9)
(29.9)
Shares issued under deferred stock plan
compensation
0.8
–
–
Shares issued upon exercise of options
–
–
0.4
0.4
Tax benefit (shortfall) related to stock plans
(14.7)
(14.7)
Stock-based compensation
26.7
26.7
Dividends declared on Class A common stock,
$1.20 per share (1)
2.8
(78.1)
(75.3)
Treasury shares purchased
(2.7)
(82.0)
(82.0)
Balance at December 31, 2013
62.0
$
1.0
$
915.8
$
1,433.2
$
(926.4)
$
(29.1)
$
1,394.5
Comprehensive earnings (loss), net of taxes
Net earnings
79.9
79.9
Other comprehensive loss
(55.6)
(55.6)
Shares issued under deferred stock plan
compensation
0.9
–
–
Deferred stock units granted under deferred
compensation election
1.2
1.2
Shares issued upon exercise of options
0.3
–
11.0
11.0
Tax benefit (shortfall) related to stock plans
(2.7)
(2.7)
Stock-based compensation
27.6
27.6
Dividends declared on Class A common stock,
$1.38 per share (2)
2.8
(88.1)
(85.3)
Treasury shares purchased
(1.9)
(80.0)
(80.0)
Balance at December 31, 2014
61.3
$
1.0
$
955.7
$
1,425.0
$
(1,006.4)
$
(84.7)
$
1,290.6
Comprehensive loss, net of taxes
Net loss
(40.4)
(40.4)
Other comprehensive loss
(80.3)
(80.3)
Shares issued under deferred stock plan
compensation
1.0
–
–
Deferred stock units granted under deferred
compensation election
1.0
1.0
Shares issued upon exercise of options
0.3
–
6.2
6.2
Tax benefit (shortfall) related to stock plans
3.5
3.5
Stock-based compensation
57.2
57.2
Purchase of shares from noncontrolling interest
(0.9)
(0.9)
Dividends declared on Class A common stock,
$1.44 per share (3)
3.2
(91.8)
(88.6)
Treasury shares purchased
(0.7)
(30.3)
(30.3)
Balance at December 31, 2015
61.9
$
1.0
$
1,025.9
$
1,292.8
$
(1,036.7)
$
(165.0)
$
1,118.0
(1) Includes $75.3 million cash dividend paid in 2013 as well as $2.8 million dividend equivalent units granted
(2) Includes $85.3 million cash dividend paid in 2014 as well as $2.8 million dividend equivalent units granted
(3) Includes $88.6 million cash dividend paid in 2015 as well as $3.2 million dividend equivalent units granted
See notes to consolidated financial statements.