Lexmark 2015 Annual Report Download - page 55
Download and view the complete annual report
Please find page 55 of the 2015 Lexmark annual report below. You can navigate through the pages in the report by either clicking on the pages listed below, or by using the keyword search tool below to find specific information within the annual report.-
 1
1 -
2
-
3
-
4
-
5
-
6
-
7
-
8
-
9
-
10
-
11
-
12
-
13
-
14
-
15
-
16
-
17
-
18
-
19
-
20
-
21
-
22
-
23
-
24
-
25
-
26
-
27
-
28
-
29
-
30
-
31
-
32
-
33
-
34
-
35
-
36
-
37
-
38
-
39
-
40
-
41
-
42
-
43
-
44
-
 45
45 -
 46
46 -
 47
47 -
 48
48 -
 49
49 -
 50
50 -
 51
51 -
 52
52 -
 53
53 -
 54
54 -
 55
55 -
 56
56 -
 57
57 -
 58
58 -
 59
59 -
 60
60 -
 61
61 -
 62
62 -
 63
63 -
 64
64 -
 65
65 -
66
-
67
-
68
-
69
-
70
-
71
-
72
-
73
-
74
-
75
-
76
-
77
-
78
-
79
-
80
-
81
-
82
-
83
-
84
-
85
-
86
-
87
-
88
-
89
-
90
-
91
-
92
-
93
-
94
-
95
-
96
-
97
-
98
-
99
-
100
-
101
-
102
-
103
-
104
-
105
-
106
-
107
-
108
-
109
-
110
-
111
-
112
-
113
-
114
-
115
-
116
-
117
-
118
-
119
-
120
-
121
-
122
-
123
-
124
-
125
-
126
-
127
-
128
-
129
-
130
-
131
-
132
-
133
-
134
-
135
-
136
-
137
-
138
-
139
-
140
-
141
 |
 |

51
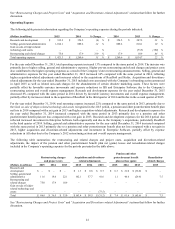
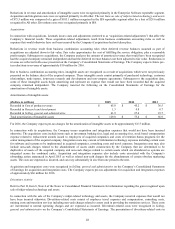
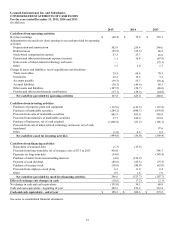
The unfavorable YTY change in Accrued liabilities and in Other assets and liabilities, collectively, was $38.5 million comparing 2015
to 2014. The Company settled a legal matter in 2015 related to copyright fees resulting in an unfavorable change of $48.4 million,
which was mainly comprised of a settlement payment of $23.3 million and the reversal of the accrued copyright fee levies of $23.5
million. Refer to Part II, Item 8, Note 19 of the Notes to Consolidated Financial Statements for additional information regarding
Commitments and Contingencies.
Although Trade receivables balances provided $29.9 million of cash in 2015, receviables provided higher cash flow for operating
activities in 2014 of $60.6 million. This $30.7 million fluctuation year over year is driven by the timing of revenue later in the last
quarter of 2015 versus 2014 in combination with higher mix of Enterprise Software revenue which typically pays slower than ISS.
The activities above were partially offset by the following factors.
Pension and postretirement contributions decreased $16.1 million year over year. Inventory decreased $22.2 million in 2015 and
$15.3 million in 2014, which reflects reduced supplies inventory levels due to exit of inkjet business and continued improvement in
inventory management.
Refer to the contractual cash obligations table that follows for additional information regarding items that will likely impact the
Company’s future cash flows.
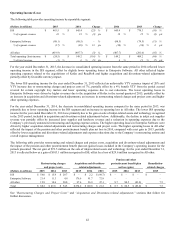
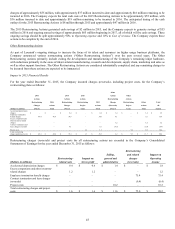
The $57.0 million decrease in cash flow from operating activities from 2013 to 2014 was driven by the following factors.
The decrease in Net earnings of $179.2 million from 2013 was affected by the non-cash YTY impact of Pension and other
postretirement expense (income) of $164.3 and the Gain on the sale of inkjet-related technology and assets of $75.3 million. This was
somewhat offset by deferred taxes related to the Pension and other postretirement expense (income) of approximately $36 million.
The unfavorable YTY change in Accrued liabilities and in Other assets and liabilities, collectively, was $142.6 million comparing
2014 to 2013. The largest factors behind the YTY movement were compensation related. Incentive compensation payments were $49
million more in 2014 than 2013. Based on payroll timing, the Company had an extra pay period in 2014 which had an unfavorable
cash flow impact of approximately $16 million. The Company settled a legal matter resulting in an unfavorable change of $14.4
million in 2014. Reimbursements for certain retiree medical expenses were down by $12.0 million due to aged items being fully
collected in 2013. Marketing program accruals drove unfavorable cash flows of $37.8 million in 2014 compared to 2013 driven b y
claim payouts. Net VAT taxes also drove another $8.5 million in unfavorable operating cash flows.
Trade receivables balances decreased $60.6 million in 2014 while they decreased $78.3 million in 2013. This $17.7 million
fluctuation between the activity in 2014 and that of 2013 is driven largely by collection efforts in 2013 which continued in 2014. This
is evidenced by the days of sales outstanding, which dropped 9 days in 2013 but only 3 additional days in 2014.
The activities above were partially offset by the following factors.
Accounts payable increased $55.7 million in 2014 while they decreased $38.4 million in 2013 resulting in a favorable impact to
operating cash flows of $94.1 million. The increase in 2014 is driven by increased purchasing activities late in the year compared to
2013.
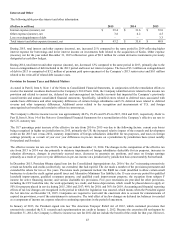
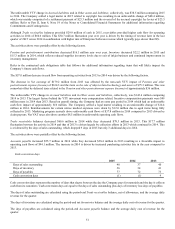
Cash conversion days
2015
2014
2013
Days of sales outstanding
40
37
40
Days of inventory
36
34
41
Days of payables
77
72
73
Cash conversion days
(1)
(1)
9
Cash conversion days represent the number of days that elapse between the day the Company pays for materials and the day it collects
cash from its customers. Cash conversion days are equal to the days of sales outstanding plus days of inventory less days of payables.
The days of sales outstanding are calculated using the period-end Trade receivables balance, net of allowances, and the average daily
revenue for the quarter.
The days of inventory are calculated using the period-end net Inventories balance and the average daily cost of revenue for the quarter.
The days of payables are calculated using the period-end Accounts payable balance and the average daily cost of revenue for the
quarter.