Dollar General 2011 Annual Report Download - page 45
Download and view the complete annual report
Please find page 45 of the 2011 Dollar General annual report below. You can navigate through the pages in the report by either clicking on the pages listed below, or by using the keyword search tool below to find specific information within the annual report.-
 1
1 -
2
-
3
-
4
-
5
-
6
-
7
-
8
-
9
-
10
-
11
-
12
-
13
-
14
-
15
-
16
-
17
-
18
-
19
-
20
-
21
-
22
-
23
-
24
-
25
-
26
-
27
-
28
-
29
-
30
-
31
-
32
-
33
-
34
-
 35
35 -
 36
36 -
 37
37 -
 38
38 -
 39
39 -
 40
40 -
 41
41 -
 42
42 -
 43
43 -
 44
44 -
 45
45 -
 46
46 -
 47
47 -
 48
48 -
 49
49 -
 50
50 -
 51
51 -
 52
52 -
 53
53 -
 54
54 -
 55
55 -
56
-
57
-
58
-
59
-
60
-
61
-
62
-
63
-
64
-
65
-
66
-
67
-
68
-
69
-
70
-
71
-
72
-
73
-
74
-
75
-
76
-
77
-
78
-
79
-
80
-
81
-
82
-
83
-
84
-
85
-
86
-
87
-
88
-
89
-
90
-
91
-
92
-
93
-
94
-
95
-
96
-
97
-
98
-
99
-
100
-
101
-
102
-
103
-
104
-
105
-
106
-
107
-
108
-
109
-
110
-
111
-
112
-
113
-
114
-
115
-
116
-
117
-
118
-
119
-
120
-
121
-
122
-
123
-
124
-
125
-
126
-
127
-
128
-
129
-
130
-
131
-
132
-
133
-
134
-
135
-
136
-
137
-
138
-
139
-
140
-
141
-
142
-
143
-
144
-
145
-
146
-
147
-
148
-
149
-
150
-
151
-
152
-
153
-
154
-
155
-
156
-
157
-
158
-
159
-
160
-
161
-
162
-
163
-
164
-
165
-
166
-
167
-
168
-
169
-
170
-
171
-
172
-
173
-
174
-
175
-
176
-
177
-
178
-
179
-
180
-
181
-
182
-
183
-
184
-
185
-
186
-
187
-
188
-
189
-
190
-
191
-
192
-
193
-
194
-
195
-
196
-
197
-
198
-
199
-
200
-
201
-
202
-
203
-
204
-
205
-
206
-
207
-
208
-
209
-
210
-
211
-
212
-
213
-
214
-
215
-
216
-
217
-
218
-
219
-
220
 |
 |

Proxy
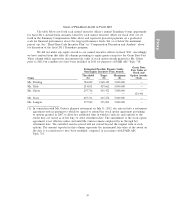
Summary Compensation Table
The following table summarizes compensation paid to or earned by our named executive
officers in each of fiscal 2011, fiscal 2010 and fiscal 2009. We have omitted from this table the columns
for Bonus, Stock Awards, and Change in Pension Value and Nonqualified Deferred Compensation
Earnings as no amounts are required to be reported in such columns for any named executive officer.
Non-Equity
Incentive
Option Plan All Other
Name and Salary Awards Compensation Compensation Total
Principal Position(1) Year ($)(2) ($)(3) ($)(4) ($) ($)
Richard W. Dreiling, 2011 1,196,947 — 1,850,386 785,036(5) 3,832,369
Chairman & 2010 1,143,231 1,193,210 2,186,595 640,293 5,163,329
Chief Executive Officer 2009 1,100,876 — 2,434,924 887,800 4,423,600
David M. Tehle, 2011 658,356 — 506,906 220,278(6) 1,385,540
Executive Vice President & 2010 642,299 — 638,125 219,450 1,499,874
Chief Financial Officer 2009 626,884 — 888,258 278,263 1,793,405
Kathleen R. Guion, 2011 636,614 124,446 490,165 198,993(7) 1,450,218
Executive Vice President, 2010 621,087 — 617,050 186,561 1,424,698
Strategic Planning & Real Estate 2009 606,180 — 858,922 247,206 1,712,308
Todd J. Vasos, 2011 636,614 — 490,165 71,712(8) 1,198,491
Executive Vice President, 2010 618,855 — 617,050 57,839 1,293,744
Division President, Chief 2009 595,023 — 840,021 91,609 1,526,653
Merchandising Officer
Susan S. Lanigan, 2011 530,326 — 414,102 122,171(9) 1,066,599
Executive Vice President &
General Counsel
(1) Ms. Guion served as our Executive Vice President, Division President, Store Operations & Store
Development until January 2012, at which time she assumed her current role. Ms. Lanigan joined Dollar
General in July 2002 but was not a named executive officer for fiscal 2010 or fiscal 2009.
(2) All named executive officers deferred under the CDP and contributed to our 401(k) Plan a portion of their
fiscal 2011 and fiscal 2010 salaries reported above. Each of Mr. Dreiling, Mr. Tehle and Ms. Guion deferred
under the CDP a portion of his or her fiscal 2009 salary reported above and, along with Mr. Vasos,
contributed to our 401(k) Plan a portion of his or her fiscal 2009 salary reported above. The amounts of the
fiscal 2011 salary deferrals under the CDP are included in the Nonqualified Deferred Compensation Table.
(3) The amount reported for Mr. Dreiling represents the aggregate grant date fair value of stock options awarded
to him in the fiscal year indicated, computed in accordance with FASB ASC Topic 718. The amount reported
for Ms. Guion represents, with respect to stock options awarded to her in 2007, the incremental fair value
computed in accordance with FASB ASC Topic 718 resulting from a deemed modification of such options as a
result of our commitment to extend the period of time in which she may exercise outstanding options that are
vested as of her July 31, 2012 retirement date. We are not obligated to provide this additional time for
Ms. Guion to exercise such options unless and until she remains employed with us through her retirement
date. This extended exercise period does not extend beyond the original term of such options. Information
regarding assumptions made in the valuation of these awards is set forth in Note 11 of the annual
consolidated financial statements in our 2011 Form 10-K.
(4) Represents amounts earned pursuant to our Teamshare bonus program for each fiscal year reported. See the
discussion of the ‘‘Short-Term Cash Incentive Plan’’ in ‘‘Compensation Discussion and Analysis’’ above.
Ms. Guion deferred 6% of her fiscal 2011 bonus payments and 5% of each of her fiscal 2010 and fiscal 2009
bonus payments under the CDP.
37