Dollar General 2011 Annual Report Download - page 134
Download and view the complete annual report
Please find page 134 of the 2011 Dollar General annual report below. You can navigate through the pages in the report by either clicking on the pages listed below, or by using the keyword search tool below to find specific information within the annual report.-
 1
1 -
2
-
3
-
4
-
5
-
6
-
7
-
8
-
9
-
10
-
11
-
12
-
13
-
14
-
15
-
16
-
17
-
18
-
19
-
20
-
21
-
22
-
23
-
24
-
25
-
26
-
27
-
28
-
29
-
30
-
31
-
32
-
33
-
34
-
35
-
36
-
37
-
38
-
39
-
40
-
41
-
42
-
43
-
44
-
45
-
46
-
47
-
48
-
49
-
50
-
51
-
52
-
53
-
54
-
55
-
56
-
57
-
58
-
59
-
60
-
61
-
62
-
63
-
64
-
65
-
66
-
67
-
68
-
69
-
70
-
71
-
72
-
73
-
74
-
75
-
76
-
77
-
78
-
79
-
80
-
81
-
82
-
83
-
84
-
85
-
86
-
87
-
88
-
89
-
90
-
91
-
92
-
93
-
94
-
95
-
96
-
97
-
98
-
99
-
100
-
101
-
102
-
103
-
104
-
105
-
106
-
107
-
108
-
109
-
110
-
111
-
112
-
113
-
114
-
115
-
116
-
117
-
118
-
119
-
120
-
121
-
122
-
123
-
 124
124 -
 125
125 -
 126
126 -
 127
127 -
 128
128 -
 129
129 -
 130
130 -
 131
131 -
 132
132 -
 133
133 -
 134
134 -
 135
135 -
 136
136 -
 137
137 -
 138
138 -
 139
139 -
 140
140 -
 141
141 -
 142
142 -
 143
143 -
 144
144 -
145
-
146
-
147
-
148
-
149
-
150
-
151
-
152
-
153
-
154
-
155
-
156
-
157
-
158
-
159
-
160
-
161
-
162
-
163
-
164
-
165
-
166
-
167
-
168
-
169
-
170
-
171
-
172
-
173
-
174
-
175
-
176
-
177
-
178
-
179
-
180
-
181
-
182
-
183
-
184
-
185
-
186
-
187
-
188
-
189
-
190
-
191
-
192
-
193
-
194
-
195
-
196
-
197
-
198
-
199
-
200
-
201
-
202
-
203
-
204
-
205
-
206
-
207
-
208
-
209
-
210
-
211
-
212
-
213
-
214
-
215
-
216
-
217
-
218
-
219
-
220
 |
 |

10-K
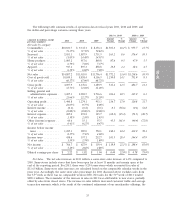
optimization of our category management processes, further improvement in store standards, and an
increase in sales prices resulting primarily from passing through certain cost increases and increased
utilization of square footage in our stores. Increases in sales of consumables outpaced our
non-consumables, with sales of packaged foods, snacks, beverages and perishables, contributing the
majority of the increase throughout the year.
The net sales increase in 2010 reflects a same-store sales increase of 4.9% compared to 2009. For
2010, there were 8,712 same-stores which accounted for sales of $12.23 billion. The remainder of the
increase in sales in 2010 was attributable to new stores, partially offset by sales from closed stores. The
increase in sales reflects the refinement of our merchandise offerings, improvements in our category
management processes and store standards, and increased utilization of square footage in our stores.
Of our four major merchandise categories, the consumables category, which generally has a lower
gross profit rate than the other three categories, has grown most significantly over the past several
years. Because of the impact of sales mix on gross profit, we continually review our merchandise mix
and strive to adjust it when appropriate. Maintaining an appropriate sales mix is an integral part of
achieving our gross profit and sales goals. Both the number of customer transactions and average
transaction amount increased in 2011 and 2010, and we believe that our stores have benefited to some
degree from attracting new customers who are seeking value as a result of the challenging
macroeconomic environment in recent years.
Gross Profit. The gross profit rate as a percentage of sales was 31.7% in 2011 compared to 32.0%
in 2010, a decline of 31 basis points. Consumables, which generally have lower markups than
non-consumables, represented a greater percentage of sales in 2011 than in 2010. Our purchase costs
increased primarily due to increased commodity costs. In addition, we incurred higher markdowns and
our transportation costs were impacted by higher fuel rates in 2011. Our LIFO provision increased to
$47.7 million in 2011 compared to $5.3 million in 2010. In 2011, our mix of home and apparel
merchandise decreased as percentage of sales and the gross profit rate within these categories
decreased due, in part, to higher markdowns. Although we saw improvement in the home category in
the latter part of 2011, we believe the economic environment continues to impede our ability to grow
sales in discretionary areas such as this. Factors positively affecting gross profit include the selective
price increases noted above as well as lower inventory shrinkage and distribution center costs, as a
percentage of sales.
The gross profit rate as a percentage of sales was 32.0% in 2010 compared to 31.3% in 2009.
Factors contributing to the increase in the 2010 gross profit rate include increased markups resulting
primarily from higher purchase markups, partially offset by increased markdowns, as well as our
category management efforts and increased sales volumes which have contributed to our ability to
reduce purchase costs from our vendors. Our merchandising team continues to work closely with our
vendors to provide quality merchandise at value prices to meet our customers’ demands. In 2010 we
recorded a LIFO provision of $5.3 million, reflecting an increase in certain merchandise costs, the most
significant of which occurred in the 2010 fourth quarter, compared to a LIFO benefit of $2.5 million in
2009.
SG&A Expense. SG&A expense was 21.7% as a percentage of sales in 2011 compared to 22.3%
in 2010, an improvement of 61 basis points reflecting the favorable impact of the 13.6% increase in
sales. In addition, retail labor expense increased at a rate lower than our increase in sales, partially due
to the rollout of our workforce management system. A decrease in incentive compensation driven by
more aggressive bonus targets, and various cost reduction efforts affecting rent, benefits, electricity and
other power costs, among other expenses, also contributed to the overall decrease in SG&A as a
percentage of sales. Costs that increased at a rate higher than our increase in sales included those
associated with our high speed store data network discussed above, depreciation and amortization
expense and fees associated with the increased use of debit cards. Depreciation and amortization
34