Dollar General 2011 Annual Report Download - page 135
Download and view the complete annual report
Please find page 135 of the 2011 Dollar General annual report below. You can navigate through the pages in the report by either clicking on the pages listed below, or by using the keyword search tool below to find specific information within the annual report.-
 1
1 -
2
-
3
-
4
-
5
-
6
-
7
-
8
-
9
-
10
-
11
-
12
-
13
-
14
-
15
-
16
-
17
-
18
-
19
-
20
-
21
-
22
-
23
-
24
-
25
-
26
-
27
-
28
-
29
-
30
-
31
-
32
-
33
-
34
-
35
-
36
-
37
-
38
-
39
-
40
-
41
-
42
-
43
-
44
-
45
-
46
-
47
-
48
-
49
-
50
-
51
-
52
-
53
-
54
-
55
-
56
-
57
-
58
-
59
-
60
-
61
-
62
-
63
-
64
-
65
-
66
-
67
-
68
-
69
-
70
-
71
-
72
-
73
-
74
-
75
-
76
-
77
-
78
-
79
-
80
-
81
-
82
-
83
-
84
-
85
-
86
-
87
-
88
-
89
-
90
-
91
-
92
-
93
-
94
-
95
-
96
-
97
-
98
-
99
-
100
-
101
-
102
-
103
-
104
-
105
-
106
-
107
-
108
-
109
-
110
-
111
-
112
-
113
-
114
-
115
-
116
-
117
-
118
-
119
-
120
-
121
-
122
-
123
-
124
-
 125
125 -
 126
126 -
 127
127 -
 128
128 -
 129
129 -
 130
130 -
 131
131 -
 132
132 -
 133
133 -
 134
134 -
 135
135 -
 136
136 -
 137
137 -
 138
138 -
 139
139 -
 140
140 -
 141
141 -
 142
142 -
 143
143 -
 144
144 -
 145
145 -
146
-
147
-
148
-
149
-
150
-
151
-
152
-
153
-
154
-
155
-
156
-
157
-
158
-
159
-
160
-
161
-
162
-
163
-
164
-
165
-
166
-
167
-
168
-
169
-
170
-
171
-
172
-
173
-
174
-
175
-
176
-
177
-
178
-
179
-
180
-
181
-
182
-
183
-
184
-
185
-
186
-
187
-
188
-
189
-
190
-
191
-
192
-
193
-
194
-
195
-
196
-
197
-
198
-
199
-
200
-
201
-
202
-
203
-
204
-
205
-
206
-
207
-
208
-
209
-
210
-
211
-
212
-
213
-
214
-
215
-
216
-
217
-
218
-
219
-
220
 |
 |

10-K
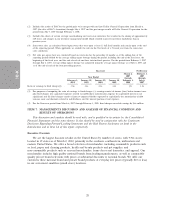
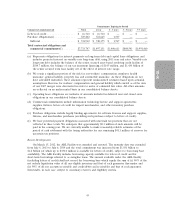
increases were primarily due to investments in the store data network and store properties purchased.
SG&A in 2011 includes expenses totaling $13.1 million for payments and accruals related to the
settlement and expected settlement of two legal matters. SG&A in 2011 and 2010 includes expenses
totaling $11.1 million and $19.7 million, respectively, for expenses (primarily share-based compensation)
incurred in connection with secondary offerings of our common stock.
SG&A expense was 22.3% as a percentage of sales in 2010 compared to 23.2% in 2009, an
improvement of 93 basis points. Decreases in incentive compensation, the cost of health benefits,
consulting fees and severance costs contributed to the overall decrease in SG&A as a percentage of
sales, as did other cost reduction and productivity initiatives. Other costs increasing at a rate lower than
our 10.5% increase in sales include utilities, which reflect lower waste management costs resulting from
our recycling efforts, as well as repairs and maintenance. Our increased sales levels in 2010 also
favorably impacted SG&A, as a percentage of sales. Debit card fees increased at a higher rate than the
increase in sales, primarily as a result of increased usage as a percentage of total transactions. As noted
above, SG&A in 2010 included expenses (primarily share-based compensation) totaling $19.7 million,
relating to two secondary offerings of our common stock. SG&A in 2009 included expenses totaling
$68.3 million, or 58 basis points, including $58.8 million relating to the termination of an advisory
agreement among us, KKR and Goldman, Sachs & Co. and $9.4 million resulting from the acceleration
of certain equity based compensation related to the completion of our initial public offering.
Interest Expense. The decrease in interest expense in 2011 compared to 2010 was primarily the
result of lower average outstanding long-term obligations and lower average interest rates due to the
redemption of our Senior Notes with cash and borrowings under our revolving credit facility in the first
half of 2011 and lower all-in interest rates on our term loan, primarily due to reduced notional
amounts on our interest rate swaps.
The decrease in interest expense in 2010 compared to 2009 was primarily the result of lower
average outstanding long-term obligations and lower all-in interest rates on our term loan, also
primarily due to reduced notional amounts on our interest rate swaps.
We had outstanding variable-rate debt of $1.63 billion and $0.93 billion as of February 3, 2012 and
January 28, 2011, respectively, after taking into consideration the impact of interest rate swaps. The
remainder of our outstanding indebtedness at February 3, 2012 and January 28, 2011 was fixed rate
debt.
See the detailed discussion under ‘‘Liquidity and Capital Resources’’ regarding indebtedness
incurred to finance our 2007 merger along with subsequent repurchases of various long-term obligations
and the related effect on interest expense in the periods presented.
Other (Income) Expense. In 2011, we recorded pretax losses of $60.3 million resulting from
repurchases of $864.3 million aggregate principal amount of our Senior Notes plus accrued and unpaid
interest.
In 2010, we recorded pretax losses of $14.7 million resulting from the repurchase in the open
market of $115.0 million aggregate principal amount of our Senior Notes plus accrued and unpaid
interest.
In 2009, we recorded charges totaling $55.5 million, which primarily represents losses on debt
retirement totaling $55.3 million, and which also includes expenses of $0.6 million related to hedge
ineffectiveness on certain of our interest rate swaps.
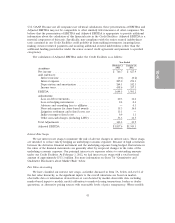
Income Taxes. The effective income tax rates for 2011, 2010, and 2009 were expenses of 37.4%,
36.3%, and 38.5%, respectively.
35