Dollar General 2011 Annual Report Download - page 127
Download and view the complete annual report
Please find page 127 of the 2011 Dollar General annual report below. You can navigate through the pages in the report by either clicking on the pages listed below, or by using the keyword search tool below to find specific information within the annual report.-
 1
1 -
2
-
3
-
4
-
5
-
6
-
7
-
8
-
9
-
10
-
11
-
12
-
13
-
14
-
15
-
16
-
17
-
18
-
19
-
20
-
21
-
22
-
23
-
24
-
25
-
26
-
27
-
28
-
29
-
30
-
31
-
32
-
33
-
34
-
35
-
36
-
37
-
38
-
39
-
40
-
41
-
42
-
43
-
44
-
45
-
46
-
47
-
48
-
49
-
50
-
51
-
52
-
53
-
54
-
55
-
56
-
57
-
58
-
59
-
60
-
61
-
62
-
63
-
64
-
65
-
66
-
67
-
68
-
69
-
70
-
71
-
72
-
73
-
74
-
75
-
76
-
77
-
78
-
79
-
80
-
81
-
82
-
83
-
84
-
85
-
86
-
87
-
88
-
89
-
90
-
91
-
92
-
93
-
94
-
95
-
96
-
97
-
98
-
99
-
100
-
101
-
102
-
103
-
104
-
105
-
106
-
107
-
108
-
109
-
110
-
111
-
112
-
113
-
114
-
115
-
116
-
 117
117 -
 118
118 -
 119
119 -
 120
120 -
 121
121 -
 122
122 -
 123
123 -
 124
124 -
 125
125 -
 126
126 -
 127
127 -
 128
128 -
 129
129 -
 130
130 -
 131
131 -
 132
132 -
 133
133 -
 134
134 -
 135
135 -
 136
136 -
 137
137 -
138
-
139
-
140
-
141
-
142
-
143
-
144
-
145
-
146
-
147
-
148
-
149
-
150
-
151
-
152
-
153
-
154
-
155
-
156
-
157
-
158
-
159
-
160
-
161
-
162
-
163
-
164
-
165
-
166
-
167
-
168
-
169
-
170
-
171
-
172
-
173
-
174
-
175
-
176
-
177
-
178
-
179
-
180
-
181
-
182
-
183
-
184
-
185
-
186
-
187
-
188
-
189
-
190
-
191
-
192
-
193
-
194
-
195
-
196
-
197
-
198
-
199
-
200
-
201
-
202
-
203
-
204
-
205
-
206
-
207
-
208
-
209
-
210
-
211
-
212
-
213
-
214
-
215
-
216
-
217
-
218
-
219
-
220
 |
 |

10-K
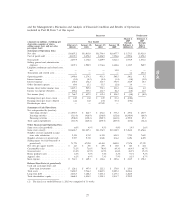
and the Management’s Discussion and Analysis of Financial Condition and Results of Operations
included in Part II, Item 7 of this report.
Successor Predecessor
March 6, February 3,
2007 2007
(Amounts in millions, excluding per Year Ended through through
share data, number of stores, February 3, January 28, January 29, January 30, February 1, July 6,
selling square feet, and net sales 2012(1) 2011 2010 2009 2008(2)(3) 2007(3)
per square foot)
Statement of Operations Data:
Net sales ................... $14,807.2 $13,035.0 $11,796.4 $10,457.7 $ 5,571.5 $3,923.8
Cost of goods sold ............. 10,109.3 8,858.4 8,106.5 7,396.6 3,999.6 2,852.2
Gross profit ................. 4,697.9 4,176.6 3,689.9 3,061.1 1,571.9 1,071.6
Selling, general and administrative
expenses .................. 3,207.1 2,902.5 2,736.6 2,448.6 1,324.5 960.9
Litigation settlement and related costs,
net...................... — — — 32.0 — —
Transaction and related costs ....... — — — — 1.2 101.4
Operating profit ............... 1,490.8 1,274.1 953.3 580.5 246.1 9.2
Interest income ............... (0.1) (0.2) (0.1) (3.1) (3.8) (5.0)
Interest expense ............... 205.0 274.2 345.7 391.9 252.9 10.3
Other (income) expense .......... 60.6 15.1 55.5 (2.8) 3.6 —
Income (loss) before income taxes . . . 1,225.3 985.0 552.1 194.4 (6.6) 4.0
Income tax expense (benefit) ....... 458.6 357.1 212.7 86.2 (1.8) 12.0
Net income (loss) .............. $ 766.7 $ 627.9 $ 339.4 $ 108.2 $ (4.8) $ (8.0)
Earnings (loss) per share—basic ..... $ 2.25 $ 1.84 $ 1.05 $ 0.34 $ (0.02)
Earnings (loss) per share—diluted . . . 2.22 1.82 1.04 0.34 (0.02)
Dividends per share ............ — — 0.7525 — —
Statement of Cash Flows Data:
Net cash provided by (used in):
Operating activities ........... $1,050.5 $ 824.7 $ 672.8 $ 575.2 $ 239.6 $ 201.9
Investing activities ............ (513.8) (418.9) (248.0) (152.6) (6,848.4) (66.9)
Financing activities ............ (908.0) (130.4) (580.7) (144.8) 6,709.0 25.3
Total capital expenditures ......... (514.9) (420.4) (250.7) (205.5) (83.6) (56.2)
Other Financial and Operating Data:
Same store sales growth(4) ........ 6.0% 4.9% 9.5% 9.0% 1.9% 2.6%
Same store sales(4) ............. $13,626.7 $12,227.1 $11,356.5 $10,118.5 $ 5,264.2 $3,656.6
Number of stores included in same
store sales calculation .......... 9,254 8,712 8,324 8,153 7,735 7,655
Number of stores (at period end) .... 9,937 9,372 8,828 8,362 8,194 8,205
Selling square feet (in thousands at
period end) ................ 71,774 67,094 62,494 58,803 57,376 57,379
Net sales per square foot(5) ....... $ 213 $ 201 $ 195 $ 180 $ 165 $ 164
Consumables sales ............. 73.2% 71.6% 70.8% 69.3% 66.4% 66.7%
Seasonal sales ................ 13.8% 14.5% 14.5% 14.6% 16.3% 15.4%
Home products sales ............ 6.8% 7.0% 7.4% 8.2% 9.1% 9.2%
Apparel sales ................. 6.2% 6.9% 7.3% 7.9% 8.2% 8.7%
Rent expense ................. $ 542.3 $ 489.3 $ 428.6 $ 389.6 $ 214.5 $ 150.2
Balance Sheet Data (at period end):
Cash and cash equivalents and
short-term investments ......... $ 126.1 $ 497.4 $ 222.1 $ 378.0 $ 119.8
Total assets .................. 9,688.5 9,546.2 8,863.5 8,889.2 8,656.4
Long-term debt ............... 2,618.5 3,288.2 3,403.4 4,137.1 4,282.0
Total shareholders’ equity ......... 4,668.5 4,054.5 3,390.3 2,831.7 2,703.9
(1) The fiscal year ended February 3, 2012 was comprised of 53 weeks.
27