Dollar General 2011 Annual Report Download - page 146
Download and view the complete annual report
Please find page 146 of the 2011 Dollar General annual report below. You can navigate through the pages in the report by either clicking on the pages listed below, or by using the keyword search tool below to find specific information within the annual report.-
 1
1 -
2
-
3
-
4
-
5
-
6
-
7
-
8
-
9
-
10
-
11
-
12
-
13
-
14
-
15
-
16
-
17
-
18
-
19
-
20
-
21
-
22
-
23
-
24
-
25
-
26
-
27
-
28
-
29
-
30
-
31
-
32
-
33
-
34
-
35
-
36
-
37
-
38
-
39
-
40
-
41
-
42
-
43
-
44
-
45
-
46
-
47
-
48
-
49
-
50
-
51
-
52
-
53
-
54
-
55
-
56
-
57
-
58
-
59
-
60
-
61
-
62
-
63
-
64
-
65
-
66
-
67
-
68
-
69
-
70
-
71
-
72
-
73
-
74
-
75
-
76
-
77
-
78
-
79
-
80
-
81
-
82
-
83
-
84
-
85
-
86
-
87
-
88
-
89
-
90
-
91
-
92
-
93
-
94
-
95
-
96
-
97
-
98
-
99
-
100
-
101
-
102
-
103
-
104
-
105
-
106
-
107
-
108
-
109
-
110
-
111
-
112
-
113
-
114
-
115
-
116
-
117
-
118
-
119
-
120
-
121
-
122
-
123
-
124
-
125
-
126
-
127
-
128
-
129
-
130
-
131
-
132
-
133
-
134
-
135
-
 136
136 -
 137
137 -
 138
138 -
 139
139 -
 140
140 -
 141
141 -
 142
142 -
 143
143 -
 144
144 -
 145
145 -
 146
146 -
 147
147 -
 148
148 -
 149
149 -
 150
150 -
 151
151 -
 152
152 -
 153
153 -
 154
154 -
 155
155 -
 156
156 -
157
-
158
-
159
-
160
-
161
-
162
-
163
-
164
-
165
-
166
-
167
-
168
-
169
-
170
-
171
-
172
-
173
-
174
-
175
-
176
-
177
-
178
-
179
-
180
-
181
-
182
-
183
-
184
-
185
-
186
-
187
-
188
-
189
-
190
-
191
-
192
-
193
-
194
-
195
-
196
-
197
-
198
-
199
-
200
-
201
-
202
-
203
-
204
-
205
-
206
-
207
-
208
-
209
-
210
-
211
-
212
-
213
-
214
-
215
-
216
-
217
-
218
-
219
-
220
 |
 |

10-K
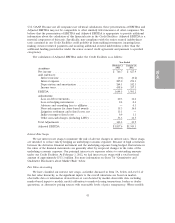
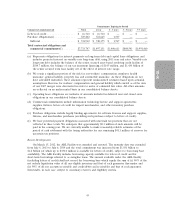
Significant components of our property and equipment purchases in 2009 included the following
approximate amounts: $114 million for improvements, upgrades, remodels and relocations of existing
stores; $69 million for new leased stores; $28 million for distribution and transportation-related capital
expenditures; $24 million for various administrative capital costs; and $11 million for information
systems upgrades and technology-related projects. During 2009 we opened 500 new stores and
remodeled or relocated 450 stores.
Capital expenditures during 2012 are projected to be in the range of $600-$650 million. We
anticipate funding 2012 capital requirements with cash flows from operations, and if necessary, we also
have significant availability under our ABL Facility. Approximately 65 percent of projected capital
spending is for investment in store growth and development for approximately 625 new stores and for
approximately 550 stores to be remodeled or relocated. Capital expenditures are anticipated for the
construction of new stores; costs related to new leased stores such as leasehold improvements, fixtures
and equipment; the purchase of existing stores; and continued investment in our existing store base.
Approximately 15 percent of projected capital spending is for transportation, distribution and special
projects; and the remaining 20 percent is for routine and ongoing capital requirements.
Included in our 2012 new store growth plans are 40 new Dollar General Market stores, some of
which we will introduce in new markets, including California and Nevada. We also intend to test a
larger format traditional store with additional coolers and freezers in several markets. The Market and
larger format traditional stores require higher investments than our traditional stores which can vary
depending on numbers of coolers, square feet, type of construction and layout. Because we are testing
several different formats, the costs of rolling out these concepts in larger quantities, should we decide
to do so, are uncertain at the present time. We plan to undertake these expenditures as part of our
efforts to improve our infrastructure and increase our cash generated from operating activities.
Cash flows from financing activities. On July 15, 2011, we redeemed $839.3 million aggregate
principal amount of our outstanding Senior Notes at total cost of $883.9 million including associated
premiums, and on April 29, 2011, we repurchased in the open market $25.0 million aggregate principal
amount of Senior Notes at a total cost of $26.8 million including associated premiums. A portion of the
July 2011 redemption of Senior Notes was financed by borrowings under the ABL Facility. Net
borrowings under the ABL Facility were $184.7 million during 2011. In December 2011, we
repurchased 4.9 million outstanding shares from our principal shareholder at a total cost of
$185.0 million.
During 2010, we repurchased $115.0 million outstanding principal amount of our outstanding
Senior Notes at a total cost of $127.5 million including associated premiums. We had no borrowings or
repayments under the ABL Facility in 2010.
In 2009, we had cash inflows from the issuance of equity of $443.8 million primarily due to our
initial public offering of 22.7 million shares of common stock. We used the proceeds from the offering
to redeem outstanding Notes with a total principal amount of $400.9 million at a premium, and used
cash generated from operations to repay $336.5 million outstanding principal amount on our Term
Loan Facility. We had no borrowings or repayments under the ABL Facility in 2009. In addition, we
paid a dividend and related amounts totaling $239.7 million using cash generated from operations.
Critical Accounting Policies and Estimates
The preparation of financial statements in accordance with U.S. GAAP requires management to
make estimates and assumptions that affect reported amounts and related disclosures. In addition to
the estimates presented below, there are other items within our financial statements that require
estimation, but are not deemed critical as defined below. We believe these estimates are reasonable and
appropriate. However, if actual experience differs from the assumptions and other considerations used,
the resulting changes could have a material effect on the financial statements taken as a whole.
46