Dollar General 2011 Annual Report Download - page 154
Download and view the complete annual report
Please find page 154 of the 2011 Dollar General annual report below. You can navigate through the pages in the report by either clicking on the pages listed below, or by using the keyword search tool below to find specific information within the annual report.-
 1
1 -
2
-
3
-
4
-
5
-
6
-
7
-
8
-
9
-
10
-
11
-
12
-
13
-
14
-
15
-
16
-
17
-
18
-
19
-
20
-
21
-
22
-
23
-
24
-
25
-
26
-
27
-
28
-
29
-
30
-
31
-
32
-
33
-
34
-
35
-
36
-
37
-
38
-
39
-
40
-
41
-
42
-
43
-
44
-
45
-
46
-
47
-
48
-
49
-
50
-
51
-
52
-
53
-
54
-
55
-
56
-
57
-
58
-
59
-
60
-
61
-
62
-
63
-
64
-
65
-
66
-
67
-
68
-
69
-
70
-
71
-
72
-
73
-
74
-
75
-
76
-
77
-
78
-
79
-
80
-
81
-
82
-
83
-
84
-
85
-
86
-
87
-
88
-
89
-
90
-
91
-
92
-
93
-
94
-
95
-
96
-
97
-
98
-
99
-
100
-
101
-
102
-
103
-
104
-
105
-
106
-
107
-
108
-
109
-
110
-
111
-
112
-
113
-
114
-
115
-
116
-
117
-
118
-
119
-
120
-
121
-
122
-
123
-
124
-
125
-
126
-
127
-
128
-
129
-
130
-
131
-
132
-
133
-
134
-
135
-
136
-
137
-
138
-
139
-
140
-
141
-
142
-
143
-
 144
144 -
 145
145 -
 146
146 -
 147
147 -
 148
148 -
 149
149 -
 150
150 -
 151
151 -
 152
152 -
 153
153 -
 154
154 -
 155
155 -
 156
156 -
 157
157 -
 158
158 -
 159
159 -
 160
160 -
 161
161 -
 162
162 -
 163
163 -
 164
164 -
165
-
166
-
167
-
168
-
169
-
170
-
171
-
172
-
173
-
174
-
175
-
176
-
177
-
178
-
179
-
180
-
181
-
182
-
183
-
184
-
185
-
186
-
187
-
188
-
189
-
190
-
191
-
192
-
193
-
194
-
195
-
196
-
197
-
198
-
199
-
200
-
201
-
202
-
203
-
204
-
205
-
206
-
207
-
208
-
209
-
210
-
211
-
212
-
213
-
214
-
215
-
216
-
217
-
218
-
219
-
220
 |
 |

10-K
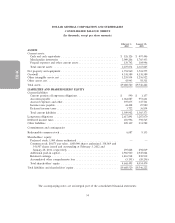
DOLLAR GENERAL CORPORATION AND SUBSIDIARIES
CONSOLIDATED BALANCE SHEETS
(In thousands, except per share amounts)
February 3, January 28,
2012 2011
ASSETS
Current assets:
Cash and cash equivalents .................................... $ 126,126 $ 497,446
Merchandise inventories ..................................... 2,009,206 1,765,433
Prepaid expenses and other current assets ......................... 139,742 104,946
Total current assets ......................................... 2,275,074 2,367,825
Net property and equipment .................................... 1,794,960 1,524,575
Goodwill .................................................. 4,338,589 4,338,589
Other intangible assets, net ..................................... 1,235,954 1,256,922
Other assets, net ............................................. 43,943 58,311
Total assets ................................................. $9,688,520 $9,546,222
LIABILITIES AND SHAREHOLDERS’ EQUITY
Current liabilities:
Current portion of long-term obligations .......................... $ 590 $ 1,157
Accounts payable .......................................... 1,064,087 953,641
Accrued expenses and other ................................... 397,075 347,741
Income taxes payable ........................................ 44,428 25,980
Deferred income taxes ....................................... 3,722 36,854
Total current liabilities ....................................... 1,509,902 1,365,373
Long-term obligations ......................................... 2,617,891 3,287,070
Deferred income taxes ........................................ 656,996 598,565
Other liabilities ............................................. 229,149 231,582
Commitments and contingencies
Redeemable common stock ..................................... 6,087 9,153
Shareholders’ equity:
Preferred stock, 1,000 shares authorized .......................... — —
Common stock; $0.875 par value, 1,000,000 shares authorized, 338,089 and
341,507 shares issued and outstanding at February 3, 2012 and
January 28, 2011, respectively ................................ 295,828 298,819
Additional paid-in capital ..................................... 2,960,940 2,945,024
Retained earnings .......................................... 1,416,918 830,932
Accumulated other comprehensive loss ........................... (5,191) (20,296)
Total shareholders’ equity .................................... 4,668,495 4,054,479
Total liabilities and shareholders’ equity ............................ $9,688,520 $9,546,222
The accompanying notes are an integral part of the consolidated financial statements.
54