Dollar General 2011 Annual Report Download - page 40
Download and view the complete annual report
Please find page 40 of the 2011 Dollar General annual report below. You can navigate through the pages in the report by either clicking on the pages listed below, or by using the keyword search tool below to find specific information within the annual report.-
 1
1 -
2
-
3
-
4
-
5
-
6
-
7
-
8
-
9
-
10
-
11
-
12
-
13
-
14
-
15
-
16
-
17
-
18
-
19
-
20
-
21
-
22
-
23
-
24
-
25
-
26
-
27
-
28
-
29
-
 30
30 -
 31
31 -
 32
32 -
 33
33 -
 34
34 -
 35
35 -
 36
36 -
 37
37 -
 38
38 -
 39
39 -
 40
40 -
 41
41 -
 42
42 -
 43
43 -
 44
44 -
 45
45 -
 46
46 -
 47
47 -
 48
48 -
 49
49 -
 50
50 -
51
-
52
-
53
-
54
-
55
-
56
-
57
-
58
-
59
-
60
-
61
-
62
-
63
-
64
-
65
-
66
-
67
-
68
-
69
-
70
-
71
-
72
-
73
-
74
-
75
-
76
-
77
-
78
-
79
-
80
-
81
-
82
-
83
-
84
-
85
-
86
-
87
-
88
-
89
-
90
-
91
-
92
-
93
-
94
-
95
-
96
-
97
-
98
-
99
-
100
-
101
-
102
-
103
-
104
-
105
-
106
-
107
-
108
-
109
-
110
-
111
-
112
-
113
-
114
-
115
-
116
-
117
-
118
-
119
-
120
-
121
-
122
-
123
-
124
-
125
-
126
-
127
-
128
-
129
-
130
-
131
-
132
-
133
-
134
-
135
-
136
-
137
-
138
-
139
-
140
-
141
-
142
-
143
-
144
-
145
-
146
-
147
-
148
-
149
-
150
-
151
-
152
-
153
-
154
-
155
-
156
-
157
-
158
-
159
-
160
-
161
-
162
-
163
-
164
-
165
-
166
-
167
-
168
-
169
-
170
-
171
-
172
-
173
-
174
-
175
-
176
-
177
-
178
-
179
-
180
-
181
-
182
-
183
-
184
-
185
-
186
-
187
-
188
-
189
-
190
-
191
-
192
-
193
-
194
-
195
-
196
-
197
-
198
-
199
-
200
-
201
-
202
-
203
-
204
-
205
-
206
-
207
-
208
-
209
-
210
-
211
-
212
-
213
-
214
-
215
-
216
-
217
-
218
-
219
-
220
 |
 |

Proxy
executive officers (other than Mr. Dreiling’s April 2010 option award) are divided so that half are
time-vested (over 5 years) and half are performance-vested (generally over 5 or 6 years) based on a
comparison of an EBITDA-based performance metric, as described below, against pre-set goals for that
performance metric. The combination of time and performance-based vesting criteria is designed to
compensate executives for long-term commitment to us, while motivating sustained increases in our
financial performance.
The vesting of the performance-based options granted prior to March 2012 is subject to
continued employment with us over the performance period and the Board’s determination that we
have achieved for each of the relevant fiscal years the specified annual performance target based on
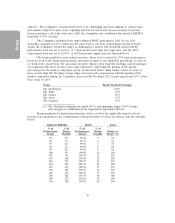
EBITDA and adjusted as described below. For fiscal years 2008-2011, those adjusted EBITDA targets
were $828 million, $961 million, $1.139 billion and $1.35 billion, respectively, which were based on the
long-term financial plan, less any anticipated permissible adjustments, primarily to account for unique
expenses related to our 2007 merger. If a performance target for a given fiscal year is not met, the
performance-based options may still vest and become exercisable on a ‘‘catch up’’ basis if, at the end of
a subsequent fiscal year, a specified cumulative adjusted EBITDA performance target is achieved. The
annual and cumulative adjusted EBITDA performance targets are based on our long-term financial
plans in existence at the time of grant. Accordingly, in each case at the time of grant, we believed those
levels, while attainable, would require strong performance and execution.
For purposes of calculating the achievement of performance targets for our long-term equity
incentive grants prior to March 2012, ‘‘EBITDA’’ means earnings before interest, taxes, depreciation
and amortization plus transaction, management and/or similar fees paid to KKR and/or its affiliates. In
addition, the Board is required to fairly and appropriately adjust the calculation of EBITDA to reflect,
to the extent not contemplated in our financial plan, the following: acquisitions, divestitures, any
change required by generally accepted accounting principles (‘‘GAAP’’) relating to share-based
compensation or for other changes in GAAP promulgated by accounting standard setters that, in each
case, the Board in good faith determines require adjustment to the EBITDA performance metric we
use for our long-term equity incentive program. Adjustments to EBITDA for purposes of calculating
performance targets for our long-term equity incentive program may not in all circumstances be
identical to adjustments to EBITDA for other purposes, including the covenants contained in our
principal financial agreements. Accordingly, comparability of such measures is limited.
All performance-based options and 80% of the time-based options granted to the named
executive officers prior to 2012, except for those granted to Mr. Vasos, are vested. We have surpassed
the cumulative adjusted EBITDA performance targets through fiscal 2011, and we anticipate surpassing
the cumulative adjusted EBITDA performance target through fiscal 2012, for Mr. Vasos’ options.
Over the last two years, the Committee has worked with its consultant and management to
develop a new long-term equity incentive structure that is more in line with typical public company
equity structures. The new structure was finalized and implemented in March 2012. Under the new
program, each of the named executive officers (other than Ms. Guion) received a grant of time-based
stock options and a grant of performance share units. The combination of time and performance-based
vesting criteria is designed to compensate executives for long-term commitment to us, while motivating
sustained increases in our shareholder value and financial performance.
Consistent with our compensation philosophy and objectives, the Committee believes that the
value of the long-term equity awards should approximate the median values of our competitive market.
As a result, the value of the long-term incentive awards was determined based on the long-term equity
target values of our 2012 market comparator group. The market value for each named executive
officer’s position other than the CEO was blended to establish a single long-term incentive value on
which awards are based for all named executive officers other than the CEO. This blending practice is
similar to that which we used in establishing the short-term cash incentive where the targets for each of
the named executive officers’ positions (other than the CEO) are also the same.
32