Dollar General 2011 Annual Report Download - page 187
Download and view the complete annual report
Please find page 187 of the 2011 Dollar General annual report below. You can navigate through the pages in the report by either clicking on the pages listed below, or by using the keyword search tool below to find specific information within the annual report.-
 1
1 -
2
-
3
-
4
-
5
-
6
-
7
-
8
-
9
-
10
-
11
-
12
-
13
-
14
-
15
-
16
-
17
-
18
-
19
-
20
-
21
-
22
-
23
-
24
-
25
-
26
-
27
-
28
-
29
-
30
-
31
-
32
-
33
-
34
-
35
-
36
-
37
-
38
-
39
-
40
-
41
-
42
-
43
-
44
-
45
-
46
-
47
-
48
-
49
-
50
-
51
-
52
-
53
-
54
-
55
-
56
-
57
-
58
-
59
-
60
-
61
-
62
-
63
-
64
-
65
-
66
-
67
-
68
-
69
-
70
-
71
-
72
-
73
-
74
-
75
-
76
-
77
-
78
-
79
-
80
-
81
-
82
-
83
-
84
-
85
-
86
-
87
-
88
-
89
-
90
-
91
-
92
-
93
-
94
-
95
-
96
-
97
-
98
-
99
-
100
-
101
-
102
-
103
-
104
-
105
-
106
-
107
-
108
-
109
-
110
-
111
-
112
-
113
-
114
-
115
-
116
-
117
-
118
-
119
-
120
-
121
-
122
-
123
-
124
-
125
-
126
-
127
-
128
-
129
-
130
-
131
-
132
-
133
-
134
-
135
-
136
-
137
-
138
-
139
-
140
-
141
-
142
-
143
-
144
-
145
-
146
-
147
-
148
-
149
-
150
-
151
-
152
-
153
-
154
-
155
-
156
-
157
-
158
-
159
-
160
-
161
-
162
-
163
-
164
-
165
-
166
-
167
-
168
-
169
-
170
-
171
-
172
-
173
-
174
-
175
-
176
-
 177
177 -
 178
178 -
 179
179 -
 180
180 -
 181
181 -
 182
182 -
 183
183 -
 184
184 -
 185
185 -
 186
186 -
 187
187 -
 188
188 -
 189
189 -
 190
190 -
 191
191 -
 192
192 -
 193
193 -
 194
194 -
 195
195 -
 196
196 -
 197
197 -
198
-
199
-
200
-
201
-
202
-
203
-
204
-
205
-
206
-
207
-
208
-
209
-
210
-
211
-
212
-
213
-
214
-
215
-
216
-
217
-
218
-
219
-
220
 |
 |

10-K
DOLLAR GENERAL CORPORATION AND SUBSIDIARIES
NOTES TO CONSOLIDATED FINANCIAL STATEMENTS (Continued)
11. Share-based payments (Continued)
Each of the Company’s management-owned shares, Rollover Options, and vested Time and
Performance options include certain provisions by which the holder of such shares, Rollover Options,
or vested Time and Performance options may require the Company to repurchase such instruments in
limited circumstances. Specifically, each such instrument is subject to a put right for a period of
365 days after termination due to the death or disability of the holder of the instrument that occurs
generally within five years from the date of grant. In such circumstances, the holder of such instruments
may require the Company to repurchase any shares at the fair market value of such shares and any
Rollover Options or vested Time and Performance options at a price equal to the intrinsic value of
such Rollover or vested Time and Performance options. Because the Company does not have control
over the circumstances in which it may be required to repurchase the outstanding shares or Rollover
Options, such shares and Rollover Options have been classified as Redeemable common stock in the
accompanying consolidated balance sheets as of these dates. The values of these equity instruments are
based upon the fair value and intrinsic value, respectively, of the underlying stock and Rollover Options
at the date of issuance. Because redemption of such shares is uncertain, such shares are not subject to
re-measurement until their redemption becomes probable.
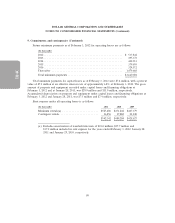
At February 3, 2012, 5,382 Rollover Options were outstanding, all of which were exercisable. The
aggregate intrinsic value of these outstanding Rollover Options was $0.2 million with a weighted
average remaining contractual term of 2.2 years, and a weighted average exercise price of $2.1875.
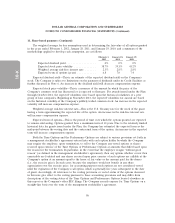
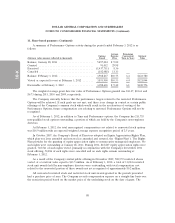
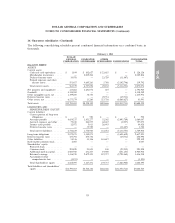
A summary of Time Options activity during the period ended February 3, 2012 is as follows:
Average Remaining
Options Exercise Contractual Intrinsic
(Intrinsic value amounts reflected in thousands) Issued Price Term in Years Value
Balance, January 28, 2011 ...................... 5,778,131 $ 9.73
Granted ................................... 91,012 29.98
Exercised .................................. (1,427,179) 8.41
Canceled ................................... (183,383) 11.09
Balance, February 3, 2012 ...................... 4,258,581 $10.55 6.3 $133,691
Vested or expected to vest at February 3, 2012 ....... 4,159,595 $10.36 6.3 $131,357
Exercisable at February 3, 2012 .................. 2,486,048 $ 9.08 6.1 $ 81,692
The weighted average grant date fair value of Time Options granted during 2011, 2010 and 2009
was $13.47, $12.61 and $6.73, respectively.
87