Dollar General 2011 Annual Report Download - page 198
Download and view the complete annual report
Please find page 198 of the 2011 Dollar General annual report below. You can navigate through the pages in the report by either clicking on the pages listed below, or by using the keyword search tool below to find specific information within the annual report.-
 1
1 -
2
-
3
-
4
-
5
-
6
-
7
-
8
-
9
-
10
-
11
-
12
-
13
-
14
-
15
-
16
-
17
-
18
-
19
-
20
-
21
-
22
-
23
-
24
-
25
-
26
-
27
-
28
-
29
-
30
-
31
-
32
-
33
-
34
-
35
-
36
-
37
-
38
-
39
-
40
-
41
-
42
-
43
-
44
-
45
-
46
-
47
-
48
-
49
-
50
-
51
-
52
-
53
-
54
-
55
-
56
-
57
-
58
-
59
-
60
-
61
-
62
-
63
-
64
-
65
-
66
-
67
-
68
-
69
-
70
-
71
-
72
-
73
-
74
-
75
-
76
-
77
-
78
-
79
-
80
-
81
-
82
-
83
-
84
-
85
-
86
-
87
-
88
-
89
-
90
-
91
-
92
-
93
-
94
-
95
-
96
-
97
-
98
-
99
-
100
-
101
-
102
-
103
-
104
-
105
-
106
-
107
-
108
-
109
-
110
-
111
-
112
-
113
-
114
-
115
-
116
-
117
-
118
-
119
-
120
-
121
-
122
-
123
-
124
-
125
-
126
-
127
-
128
-
129
-
130
-
131
-
132
-
133
-
134
-
135
-
136
-
137
-
138
-
139
-
140
-
141
-
142
-
143
-
144
-
145
-
146
-
147
-
148
-
149
-
150
-
151
-
152
-
153
-
154
-
155
-
156
-
157
-
158
-
159
-
160
-
161
-
162
-
163
-
164
-
165
-
166
-
167
-
168
-
169
-
170
-
171
-
172
-
173
-
174
-
175
-
176
-
177
-
178
-
179
-
180
-
181
-
182
-
183
-
184
-
185
-
186
-
187
-
 188
188 -
 189
189 -
 190
190 -
 191
191 -
 192
192 -
 193
193 -
 194
194 -
 195
195 -
 196
196 -
 197
197 -
 198
198 -
 199
199 -
 200
200 -
 201
201 -
 202
202 -
 203
203 -
 204
204 -
 205
205 -
 206
206 -
 207
207 -
 208
208 -
209
-
210
-
211
-
212
-
213
-
214
-
215
-
216
-
217
-
218
-
219
-
220
 |
 |

10-K
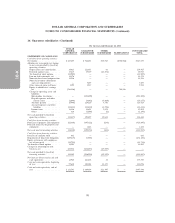
DOLLAR GENERAL CORPORATION AND SUBSIDIARIES
NOTES TO CONSOLIDATED FINANCIAL STATEMENTS (Continued)
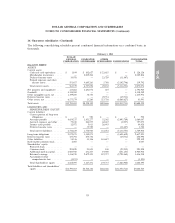
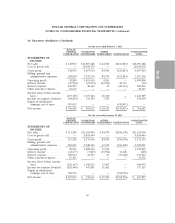
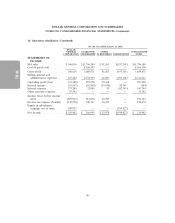
16. Guarantor subsidiaries (Continued)
For the year ended January 28, 2011
DOLLAR
GENERAL GUARANTOR OTHER CONSOLIDATED
CORPORATION SUBSIDIARIES SUBSIDIARIES ELIMINATIONS TOTAL
STATEMENTS OF CASH FLOWS:
Cash flows from operating activities:
Net income ................ $627,857 $ 742,631 $ 25,925 $(768,556) $ 627,857
Adjustments to reconcile net income
to net cash provided by (used in)
operating activities:
Depreciation and amortization . . . 33,015 221,851 61 — 254,927
Deferred income taxes ........ 17,817 47,719 (14,551) — 50,985
Tax benefit of stock options ..... (13,905) — — — (13,905)
Loss on debt retirement, net .... 14,576 — — — 14,576
Noncash share-based compensation 15,956 — — — 15,956
Noncash inventory adjustments
and asset impairments ...... — 7,607 — — 7,607
Other noncash gains and losses . . 1,395 4,547 — — 5,942
Equity in subsidiaries’ earnings,
net .................. (768,556) — — 768,556 —
Change in operating assets and
liabilities:
Merchandise inventories ..... — (251,809) — — (251,809)
Prepaid expenses and other
current assets .......... (1,646) (3,642) (4,869) — (10,157)
Accounts payable ......... (5,446) 124,120 4,750 — 123,424
Accrued expenses and other
liabilities ............. (28,442) (12,410) (1,576) — (42,428)
Income taxes ............ 18,136 14,891 9,876 — 42,903
Other ................ 816 (2,008) (2) — (1,194)
Net cash provided by (used in)
operating activities .......... (88,427) 893,497 19,614 — 824,684
Cash flows from investing activities:
Purchases of property and equipment (22,830) (397,322) (243) — (420,395)
Proceeds from sales of property and
equipment ............... — 1,448 — — 1,448
Net cash used in investing activities . (22,830) (395,874) (243) — (418,947)
Cash flows from financing activities:
Issuance of common stock ....... 631 — — — 631
Repayments of long-term obligations (129,217) (1,963) — — (131,180)
Equity settlements with employees,
net of taxes paid ........... (13,723) — — — (13,723)
Tax benefit of stock options ...... 13,905 — — — 13,905
Changes in intercompany note
balances, net ............. 253,586 (234,257) (19,329) — —
Net cash provided by (used in)
financing activities .......... 125,182 (236,220) (19,329) — (130,367)
Net increase (decrease) in cash and
cash equivalents ............ 13,925 261,403 42 — 275,370
Cash and cash equivalents, beginning
of year ................. 97,620 103,001 21,455 — 222,076
Cash and cash equivalents, end of
year ................... $111,545 $ 364,404 $ 21,497 $ — $ 497,446
98