Dollar General 2011 Annual Report Download - page 106
Download and view the complete annual report
Please find page 106 of the 2011 Dollar General annual report below. You can navigate through the pages in the report by either clicking on the pages listed below, or by using the keyword search tool below to find specific information within the annual report.-
 1
1 -
2
-
3
-
4
-
5
-
6
-
7
-
8
-
9
-
10
-
11
-
12
-
13
-
14
-
15
-
16
-
17
-
18
-
19
-
20
-
21
-
22
-
23
-
24
-
25
-
26
-
27
-
28
-
29
-
30
-
31
-
32
-
33
-
34
-
35
-
36
-
37
-
38
-
39
-
40
-
41
-
42
-
43
-
44
-
45
-
46
-
47
-
48
-
49
-
50
-
51
-
52
-
53
-
54
-
55
-
56
-
57
-
58
-
59
-
60
-
61
-
62
-
63
-
64
-
65
-
66
-
67
-
68
-
69
-
70
-
71
-
72
-
73
-
74
-
75
-
76
-
77
-
78
-
79
-
80
-
81
-
82
-
83
-
84
-
85
-
86
-
87
-
88
-
89
-
90
-
91
-
92
-
93
-
94
-
95
-
 96
96 -
 97
97 -
 98
98 -
 99
99 -
 100
100 -
 101
101 -
 102
102 -
 103
103 -
 104
104 -
 105
105 -
 106
106 -
 107
107 -
 108
108 -
 109
109 -
 110
110 -
 111
111 -
 112
112 -
 113
113 -
 114
114 -
 115
115 -
 116
116 -
117
-
118
-
119
-
120
-
121
-
122
-
123
-
124
-
125
-
126
-
127
-
128
-
129
-
130
-
131
-
132
-
133
-
134
-
135
-
136
-
137
-
138
-
139
-
140
-
141
-
142
-
143
-
144
-
145
-
146
-
147
-
148
-
149
-
150
-
151
-
152
-
153
-
154
-
155
-
156
-
157
-
158
-
159
-
160
-
161
-
162
-
163
-
164
-
165
-
166
-
167
-
168
-
169
-
170
-
171
-
172
-
173
-
174
-
175
-
176
-
177
-
178
-
179
-
180
-
181
-
182
-
183
-
184
-
185
-
186
-
187
-
188
-
189
-
190
-
191
-
192
-
193
-
194
-
195
-
196
-
197
-
198
-
199
-
200
-
201
-
202
-
203
-
204
-
205
-
206
-
207
-
208
-
209
-
210
-
211
-
212
-
213
-
214
-
215
-
216
-
217
-
218
-
219
-
220
 |
 |

10-K
The Dollar General Store
The average Dollar General store has approximately 7,200 square feet of selling space and is
typically operated by a store manager, an assistant store manager and three or more sales clerks.
Approximately 60% of our stores are in freestanding buildings and 40% are in strip shopping centers.
Most of our customers live within three to five miles, or a 10 minute drive, of our stores. Our
traditional store strategy features low initial capital expenditures, limited maintenance capital, low
occupancy and operating costs, and a focused merchandise offering within a broad range of categories,
allowing us to deliver low retail prices while generating strong cash flows and investment returns. In
2011, the average cost of equipment and fixtures in our traditional leased stores was approximately
$180,000. Initial inventory, net of payables, increases the investment in a new store by approximately
$75,000.
We generally have had good success in locating suitable store sites in the past. Given the size of
the communities that we target, we believe that there is ample opportunity for new store growth in
existing and new markets. In addition, the current real estate market has continued to provide
opportunities for us to access higher quality sites at lower rates than in recent years. Also, we believe
we have significant opportunities available for our relocation and remodel programs. We spend
approximately $80,000 for equipment and fixtures to remodel a traditional store and approximately
$160,000 to relocate a traditional store. We remodeled or relocated 575 stores in 2011, 504 in 2010 and
450 in 2009.
At the end of 2011, our total store count included 69 Dollar General Market stores, which, in
addition to the merchandise offering of a traditional Dollar General store, feature an expanded food
section, including fresh meat and produce and significantly more frozen and refrigerated foods. These
stores, which average approximately 16,000 square feet of selling space, are an alternative to the typical
grocery store or supermarket, and generally contribute more to sales and operating income than our
traditional stores. In 2011, we opened 12 new Dollar General Markets, including seven as part of our
initial entrance into Nevada. We plan to open approximately 40 new Dollar General Markets in 2012,
including a significant percentage of our initial stores in California. Our focus is on locating the Dollar
General Market stores in areas that are generally underserved by large grocery chains. We continue to
test and adjust the Dollar General Market concept and how we build and open the stores, as the
capital investment for these stores is significantly higher than our traditional stores. In addition to the
Market stores, we are also testing a larger format traditional store with approximately 10,000 square
feet of selling space, including an expanded section of coolers and freezers. Like the Dollar General
Market stores, these larger format stores currently require significantly higher capital investment than
our traditional stores and we are working to reduce that difference.
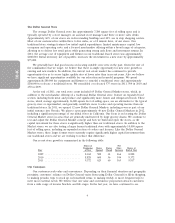
Our recent store growth is summarized in the following table:
Stores at Net
Beginning Stores Stores Store Stores at
Year of Year Opened Closed Increase End of Year
2009 ....................... 8,362 500 34 466 8,828
2010 ....................... 8,828 600 56 544 9,372
2011 ....................... 9,372 625 60 565 9,937
Our Customers
Our customers seek value and convenience. Depending on their financial situation and geographic
proximity, customers’ reliance on Dollar General varies from using Dollar General for fill-in shopping,
to making periodic trips to stock up on household items, to making weekly or more frequent trips to
meet most essential needs. We believe that our value and convenience proposition attracts customers
from a wide range of income brackets and life stages. In the last year, we have continued to see
6