Dollar General 2011 Annual Report Download - page 136
Download and view the complete annual report
Please find page 136 of the 2011 Dollar General annual report below. You can navigate through the pages in the report by either clicking on the pages listed below, or by using the keyword search tool below to find specific information within the annual report.-
 1
1 -
2
-
3
-
4
-
5
-
6
-
7
-
8
-
9
-
10
-
11
-
12
-
13
-
14
-
15
-
16
-
17
-
18
-
19
-
20
-
21
-
22
-
23
-
24
-
25
-
26
-
27
-
28
-
29
-
30
-
31
-
32
-
33
-
34
-
35
-
36
-
37
-
38
-
39
-
40
-
41
-
42
-
43
-
44
-
45
-
46
-
47
-
48
-
49
-
50
-
51
-
52
-
53
-
54
-
55
-
56
-
57
-
58
-
59
-
60
-
61
-
62
-
63
-
64
-
65
-
66
-
67
-
68
-
69
-
70
-
71
-
72
-
73
-
74
-
75
-
76
-
77
-
78
-
79
-
80
-
81
-
82
-
83
-
84
-
85
-
86
-
87
-
88
-
89
-
90
-
91
-
92
-
93
-
94
-
95
-
96
-
97
-
98
-
99
-
100
-
101
-
102
-
103
-
104
-
105
-
106
-
107
-
108
-
109
-
110
-
111
-
112
-
113
-
114
-
115
-
116
-
117
-
118
-
119
-
120
-
121
-
122
-
123
-
124
-
125
-
 126
126 -
 127
127 -
 128
128 -
 129
129 -
 130
130 -
 131
131 -
 132
132 -
 133
133 -
 134
134 -
 135
135 -
 136
136 -
 137
137 -
 138
138 -
 139
139 -
 140
140 -
 141
141 -
 142
142 -
 143
143 -
 144
144 -
 145
145 -
 146
146 -
147
-
148
-
149
-
150
-
151
-
152
-
153
-
154
-
155
-
156
-
157
-
158
-
159
-
160
-
161
-
162
-
163
-
164
-
165
-
166
-
167
-
168
-
169
-
170
-
171
-
172
-
173
-
174
-
175
-
176
-
177
-
178
-
179
-
180
-
181
-
182
-
183
-
184
-
185
-
186
-
187
-
188
-
189
-
190
-
191
-
192
-
193
-
194
-
195
-
196
-
197
-
198
-
199
-
200
-
201
-
202
-
203
-
204
-
205
-
206
-
207
-
208
-
209
-
210
-
211
-
212
-
213
-
214
-
215
-
216
-
217
-
218
-
219
-
220
 |
 |

10-K
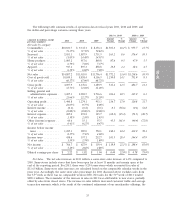
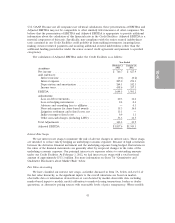
The 2011 effective tax rate of 37.4% was greater than the statutory tax rate of 35% due primarily
to the inclusion of state income taxes in the total effective tax rate. The 2011 effective rate was greater
than the 2010 rate of 36.3% primarily due to the effective resolution of various examinations by the
taxing authorities in 2010 that did not reoccur, to the same extent, in 2011. These factors resulted in
rate increases in 2011, as compared to 2010, associated with state income taxes and income tax related
interest expense. Increases in federal jobs related tax credits, primarily due to the Hire Act’s Retention
Credit, reduced the effective rate in 2011 as compared to 2010. The Retention Credit was only effective
for 2011. Other provisions authorizing various federal jobs credits (primarily the Work Opportunity Tax
Credit or WOTC) that we receive have generally expired for employees hired after December 31, 2011.
Barring re-enactment of these credits by Congress, the benefit realized by the company associated with
jobs credits in 2012 will be significantly lower than the benefit realized in 2011, thereby increasing the
2012 effective rate. We anticipate that the combined lapse of the Retention Credit and the expiration
of the other jobs credits (WOTC) will increase our 2012 effective rate by approximately 1.0% as
compared to the 2011 rate.
The 2010 effective tax rate of 36.3% was greater than the statutory tax rate of 35%, also due
primarily to the inclusion of state income taxes in the total effective tax rate. The 2010 effective rate
was less than the 2009 rate due principally to reductions in state income tax expense, income tax
related interest expense and other expense items. The 2010 effective resolution of various examinations
by the taxing authorities, when combined with unfavorable examination results in 2009, resulted in a
decrease in the year-to-year state income tax expense rate. This decrease in state income tax expense
was partially offset by an increase in state income tax expense due to a shift in income to companies
within the group that have a higher effective state income tax rate. In addition, decreases also occurred
due to favorable outcomes in 2010 associated with reductions in income tax related interest accruals
and income tax related penalty accruals due to favorable income tax examination results, the
completion of a federal income tax examination, and reductions in expense associated with uncertain
tax benefit accruals.
The 2009 effective tax rate of 38.5% was greater than the statutory tax rate of 35% due primarily
to the inclusion of state income taxes in the total effective tax rate.
Off Balance Sheet Arrangements
The entities involved in ownership structure underlying the leases for three of our distribution
centers meet the accounting definition of a Variable Interest Entity (‘‘VIE’’). One of these distribution
centers has been recorded as a financing obligation whereby its property and equipment are reflected
in our consolidated balance sheets. The land and buildings of the other two distribution centers have
been recorded as operating leases. We are not the primary beneficiary of these VIEs and, accordingly,
have not included these entities in our consolidated financial statements. Other than the foregoing, we
are not party to any off balance sheet arrangements.
Effects of Inflation
In 2011, we experienced increased commodity cost pressures mainly related to food, housewares
and apparel products which were driven by increases in cotton, sugar, coffee, groundnut, resin,
petroleum and other raw material commodity costs. We believe that our ability to selectively increase
selling prices in response to cost increases partially mitigated the effect of these cost increases on our
overall results of operations. We experienced little or no overall product cost inflation in 2010 and
2009.
36