Dollar General 2011 Annual Report Download - page 196
Download and view the complete annual report
Please find page 196 of the 2011 Dollar General annual report below. You can navigate through the pages in the report by either clicking on the pages listed below, or by using the keyword search tool below to find specific information within the annual report.-
 1
1 -
2
-
3
-
4
-
5
-
6
-
7
-
8
-
9
-
10
-
11
-
12
-
13
-
14
-
15
-
16
-
17
-
18
-
19
-
20
-
21
-
22
-
23
-
24
-
25
-
26
-
27
-
28
-
29
-
30
-
31
-
32
-
33
-
34
-
35
-
36
-
37
-
38
-
39
-
40
-
41
-
42
-
43
-
44
-
45
-
46
-
47
-
48
-
49
-
50
-
51
-
52
-
53
-
54
-
55
-
56
-
57
-
58
-
59
-
60
-
61
-
62
-
63
-
64
-
65
-
66
-
67
-
68
-
69
-
70
-
71
-
72
-
73
-
74
-
75
-
76
-
77
-
78
-
79
-
80
-
81
-
82
-
83
-
84
-
85
-
86
-
87
-
88
-
89
-
90
-
91
-
92
-
93
-
94
-
95
-
96
-
97
-
98
-
99
-
100
-
101
-
102
-
103
-
104
-
105
-
106
-
107
-
108
-
109
-
110
-
111
-
112
-
113
-
114
-
115
-
116
-
117
-
118
-
119
-
120
-
121
-
122
-
123
-
124
-
125
-
126
-
127
-
128
-
129
-
130
-
131
-
132
-
133
-
134
-
135
-
136
-
137
-
138
-
139
-
140
-
141
-
142
-
143
-
144
-
145
-
146
-
147
-
148
-
149
-
150
-
151
-
152
-
153
-
154
-
155
-
156
-
157
-
158
-
159
-
160
-
161
-
162
-
163
-
164
-
165
-
166
-
167
-
168
-
169
-
170
-
171
-
172
-
173
-
174
-
175
-
176
-
177
-
178
-
179
-
180
-
181
-
182
-
183
-
184
-
185
-
 186
186 -
 187
187 -
 188
188 -
 189
189 -
 190
190 -
 191
191 -
 192
192 -
 193
193 -
 194
194 -
 195
195 -
 196
196 -
 197
197 -
 198
198 -
 199
199 -
 200
200 -
 201
201 -
 202
202 -
 203
203 -
 204
204 -
 205
205 -
 206
206 -
207
-
208
-
209
-
210
-
211
-
212
-
213
-
214
-
215
-
216
-
217
-
218
-
219
-
220
 |
 |

10-K
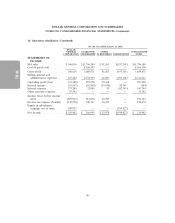
DOLLAR GENERAL CORPORATION AND SUBSIDIARIES
NOTES TO CONSOLIDATED FINANCIAL STATEMENTS (Continued)
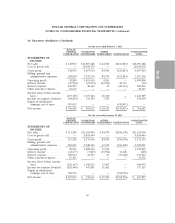
16. Guarantor subsidiaries (Continued)
For the year ended January 29, 2010
DOLLAR
GENERAL GUARANTOR OTHER CONSOLIDATED
CORPORATION SUBSIDIARIES SUBSIDIARIES ELIMINATIONS TOTAL
STATEMENTS OF
INCOME:
Net sales ............... $306,036 $11,796,380 $ 91,265 $(397,301) $11,796,380
Cost of goods sold ........ — 8,106,509 — — 8,106,509
Gross profit ............. 306,036 3,689,871 91,265 (397,301) 3,689,871
Selling, general and
administrative expenses . . . 337,224 2,734,793 61,897 (397,301) 2,736,613
Operating profit (loss) ..... (31,188) 955,078 29,368 — 953,258
Interest income .......... (52,047) (10,968) (19,674) 82,545 (144)
Interest expense .......... 375,280 52,980 29 (82,545) 345,744
Other (income) expense .... 55,542 — — — 55,542
Income (loss) before income
taxes ................ (409,963) 913,066 49,013 — 552,116
Income tax expense (benefit) (149,478) 346,117 16,035 — 212,674
Equity in subsidiaries’
earnings, net of taxes .... 599,927 — — (599,927) —
Net income ............. $339,442 $ 566,949 $ 32,978 $(599,927) $ 339,442
96