Dollar General 2011 Annual Report Download - page 158
Download and view the complete annual report
Please find page 158 of the 2011 Dollar General annual report below. You can navigate through the pages in the report by either clicking on the pages listed below, or by using the keyword search tool below to find specific information within the annual report.-
 1
1 -
2
-
3
-
4
-
5
-
6
-
7
-
8
-
9
-
10
-
11
-
12
-
13
-
14
-
15
-
16
-
17
-
18
-
19
-
20
-
21
-
22
-
23
-
24
-
25
-
26
-
27
-
28
-
29
-
30
-
31
-
32
-
33
-
34
-
35
-
36
-
37
-
38
-
39
-
40
-
41
-
42
-
43
-
44
-
45
-
46
-
47
-
48
-
49
-
50
-
51
-
52
-
53
-
54
-
55
-
56
-
57
-
58
-
59
-
60
-
61
-
62
-
63
-
64
-
65
-
66
-
67
-
68
-
69
-
70
-
71
-
72
-
73
-
74
-
75
-
76
-
77
-
78
-
79
-
80
-
81
-
82
-
83
-
84
-
85
-
86
-
87
-
88
-
89
-
90
-
91
-
92
-
93
-
94
-
95
-
96
-
97
-
98
-
99
-
100
-
101
-
102
-
103
-
104
-
105
-
106
-
107
-
108
-
109
-
110
-
111
-
112
-
113
-
114
-
115
-
116
-
117
-
118
-
119
-
120
-
121
-
122
-
123
-
124
-
125
-
126
-
127
-
128
-
129
-
130
-
131
-
132
-
133
-
134
-
135
-
136
-
137
-
138
-
139
-
140
-
141
-
142
-
143
-
144
-
145
-
146
-
147
-
 148
148 -
 149
149 -
 150
150 -
 151
151 -
 152
152 -
 153
153 -
 154
154 -
 155
155 -
 156
156 -
 157
157 -
 158
158 -
 159
159 -
 160
160 -
 161
161 -
 162
162 -
 163
163 -
 164
164 -
 165
165 -
 166
166 -
 167
167 -
 168
168 -
169
-
170
-
171
-
172
-
173
-
174
-
175
-
176
-
177
-
178
-
179
-
180
-
181
-
182
-
183
-
184
-
185
-
186
-
187
-
188
-
189
-
190
-
191
-
192
-
193
-
194
-
195
-
196
-
197
-
198
-
199
-
200
-
201
-
202
-
203
-
204
-
205
-
206
-
207
-
208
-
209
-
210
-
211
-
212
-
213
-
214
-
215
-
216
-
217
-
218
-
219
-
220
 |
 |

10-K
DOLLAR GENERAL CORPORATION AND SUBSIDIARIES
NOTES TO CONSOLIDATED FINANCIAL STATEMENTS
1. Basis of presentation and accounting policies
Basis of presentation
These notes contain references to the years 2011, 2010 and 2009, which represent fiscal years
ended February 3, 2012, January 28, 2011, and January 29, 2010, respectively. 2011 was a 53-week
accounting period while 2010 and 2009 were 52-week accounting periods. The Company’s fiscal year
ends on the Friday closest to January 31. The consolidated financial statements include all subsidiaries
of the Company, except for its not-for-profit subsidiary which the Company does not control.
Intercompany transactions have been eliminated.
Business description
The Company sells general merchandise on a retail basis through 9,937 stores (as of February 3,
2012) in 38 states covering most of the southern, southwestern, midwestern and eastern United States.
The Company owns distribution centers (‘‘DCs’’) in Scottsville, Kentucky; South Boston, Virginia;
Alachua, Florida; Zanesville, Ohio; Jonesville, South Carolina and Marion, Indiana, and leases DCs in
Ardmore, Oklahoma; Fulton, Missouri and Indianola, Mississippi. At February 3, 2012, the Company
has a DC under construction in Bessemer, Alabama which it will own and has leased space for a DC in
Lebec, California, neither of which were operational at that date.
The Company purchases its merchandise from a wide variety of suppliers. Approximately 8% and
7% of the Company’s purchases in 2011 were made from the Company’s largest and second largest
suppliers, respectively.
Cash and cash equivalents
Cash and cash equivalents include highly liquid investments with insignificant interest rate risk and
original maturities of three months or less when purchased. Such investments primarily consist of
money market funds, bank deposits, certificates of deposit (which may include foreign time deposits),
and commercial paper. The carrying amounts of these items are a reasonable estimate of their fair
value due to the short maturity of these investments.
Payments due from processors for electronic tender transactions classified as cash and cash
equivalents totaled approximately $38.7 million and $26.1 million at February 3, 2012 and January 28,
2011, respectively.
The Company’s cash management system provides for daily investment of available balances and
the funding of outstanding checks when presented for payment. Outstanding but unpresented checks
totaling approximately $148.3 million and $153.6 million at February 3, 2012 and January 28, 2011,
respectively, have been included in Accounts payable in the consolidated balance sheets. Upon
presentation for payment, these checks are funded through available cash balances or the Company’s
credit facilities.
At February 3, 2012, the Company maintained cash balances to meet a $20 million minimum
threshold set by insurance regulators, as further described below under ‘‘Insurance liabilities.’’
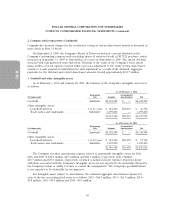
Investments in debt and equity securities
The Company accounts for investments in debt and marketable equity securities as
held-to-maturity, available-for-sale, or trading, depending on their classification. Debt securities
58