Dollar General 2011 Annual Report Download - page 108
Download and view the complete annual report
Please find page 108 of the 2011 Dollar General annual report below. You can navigate through the pages in the report by either clicking on the pages listed below, or by using the keyword search tool below to find specific information within the annual report.-
 1
1 -
2
-
3
-
4
-
5
-
6
-
7
-
8
-
9
-
10
-
11
-
12
-
13
-
14
-
15
-
16
-
17
-
18
-
19
-
20
-
21
-
22
-
23
-
24
-
25
-
26
-
27
-
28
-
29
-
30
-
31
-
32
-
33
-
34
-
35
-
36
-
37
-
38
-
39
-
40
-
41
-
42
-
43
-
44
-
45
-
46
-
47
-
48
-
49
-
50
-
51
-
52
-
53
-
54
-
55
-
56
-
57
-
58
-
59
-
60
-
61
-
62
-
63
-
64
-
65
-
66
-
67
-
68
-
69
-
70
-
71
-
72
-
73
-
74
-
75
-
76
-
77
-
78
-
79
-
80
-
81
-
82
-
83
-
84
-
85
-
86
-
87
-
88
-
89
-
90
-
91
-
92
-
93
-
94
-
95
-
96
-
97
-
 98
98 -
 99
99 -
 100
100 -
 101
101 -
 102
102 -
 103
103 -
 104
104 -
 105
105 -
 106
106 -
 107
107 -
 108
108 -
 109
109 -
 110
110 -
 111
111 -
 112
112 -
 113
113 -
 114
114 -
 115
115 -
 116
116 -
 117
117 -
 118
118 -
119
-
120
-
121
-
122
-
123
-
124
-
125
-
126
-
127
-
128
-
129
-
130
-
131
-
132
-
133
-
134
-
135
-
136
-
137
-
138
-
139
-
140
-
141
-
142
-
143
-
144
-
145
-
146
-
147
-
148
-
149
-
150
-
151
-
152
-
153
-
154
-
155
-
156
-
157
-
158
-
159
-
160
-
161
-
162
-
163
-
164
-
165
-
166
-
167
-
168
-
169
-
170
-
171
-
172
-
173
-
174
-
175
-
176
-
177
-
178
-
179
-
180
-
181
-
182
-
183
-
184
-
185
-
186
-
187
-
188
-
189
-
190
-
191
-
192
-
193
-
194
-
195
-
196
-
197
-
198
-
199
-
200
-
201
-
202
-
203
-
204
-
205
-
206
-
207
-
208
-
209
-
210
-
211
-
212
-
213
-
214
-
215
-
216
-
217
-
218
-
219
-
220
 |
 |

10-K
Seasonality
Our business is seasonal to a certain extent. Generally, our highest sales volume occurs in the
fourth quarter, which includes the Christmas selling season, and the lowest occurs in the first quarter.
In addition, our quarterly results can be affected by the timing of certain holidays, the timing of new
store openings and store closings, the amount of sales contributed by new and existing stores, as well as
financial transactions such as debt repurchases, common stock offerings and stock repurchases. We
purchase substantial amounts of inventory in the third quarter and incur higher shipping costs and
higher payroll costs in anticipation of the increased sales activity during the fourth quarter. In addition,
we carry merchandise during our fourth quarter that we do not carry during the rest of the year, such
as gift sets, holiday decorations, certain baking items, and a broader assortment of toys and candy.
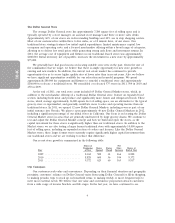
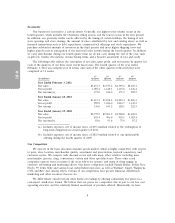
The following table reflects the seasonality of net sales, gross profit, and net income by quarter for
each of the quarters of our three most recent fiscal years. The fourth quarter of the year ended
February 3, 2012 was comprised of 14 weeks, and each of the other quarters reflected below were
comprised of 13 weeks.
1st 2nd 3rd 4th
(in millions) Quarter Quarter Quarter Quarter
Year Ended February 3, 2012
Net sales ......................... $3,451.7 $3,575.2 $3,595.2 $4,185.1
Gross profit ...................... 1,087.4 1,148.3 1,115.8 1,346.4
Net income(a) ..................... 157.0 146.0 171.2 292.5
Year Ended January 28, 2011
Net sales ......................... $3,111.3 $3,214.2 $3,223.4 $3,486.1
Gross profit ...................... 999.8 1,036.0 1,010.7 1,130.2
Net income ....................... 136.0 141.2 128.1 222.5
Year Ended January 29, 2010
Net sales ......................... $2,779.9 $2,901.9 $2,928.8 $3,185.8
Gross profit ...................... 855.4 906.0 903.1 1,025.4
Net income(b) ..................... 83.0 93.6 75.6 87.2
(a) Includes expenses, net of income taxes, of $35.4 million related to the redemption of
long-term obligations in second quarter of 2011.
(b) Includes expenses, net of income taxes, of $82.9 million related to our initial public
offering during the fourth quarter of 2009.
Our Competition
We operate in the basic discount consumer goods market, which is highly competitive with respect
to price, store location, merchandise quality, assortment and presentation, in-stock consistency, and
customer service. We compete with discount stores and with many other retailers, including mass
merchandise, grocery, drug, convenience, variety and other specialty stores. These other retail
companies operate stores in many of the areas where we operate, and many of them engage in
extensive advertising and marketing efforts. Our direct competitors include Family Dollar, Dollar Tree,
Fred’s, 99 Cents Only and various local, independent operators, as well as Walmart, Target, Walgreens,
CVS, and Rite Aid, among others. Certain of our competitors have greater financial, distribution,
marketing and other resources than we do.
We differentiate ourselves from other forms of retailing by offering consistently low prices in a
convenient, small-store format. We believe that our prices are competitive due in part to our low cost
operating structure and the relatively limited assortment of products offered. Historically, we have
8