Dollar General 2011 Annual Report Download - page 171
Download and view the complete annual report
Please find page 171 of the 2011 Dollar General annual report below. You can navigate through the pages in the report by either clicking on the pages listed below, or by using the keyword search tool below to find specific information within the annual report.-
 1
1 -
2
-
3
-
4
-
5
-
6
-
7
-
8
-
9
-
10
-
11
-
12
-
13
-
14
-
15
-
16
-
17
-
18
-
19
-
20
-
21
-
22
-
23
-
24
-
25
-
26
-
27
-
28
-
29
-
30
-
31
-
32
-
33
-
34
-
35
-
36
-
37
-
38
-
39
-
40
-
41
-
42
-
43
-
44
-
45
-
46
-
47
-
48
-
49
-
50
-
51
-
52
-
53
-
54
-
55
-
56
-
57
-
58
-
59
-
60
-
61
-
62
-
63
-
64
-
65
-
66
-
67
-
68
-
69
-
70
-
71
-
72
-
73
-
74
-
75
-
76
-
77
-
78
-
79
-
80
-
81
-
82
-
83
-
84
-
85
-
86
-
87
-
88
-
89
-
90
-
91
-
92
-
93
-
94
-
95
-
96
-
97
-
98
-
99
-
100
-
101
-
102
-
103
-
104
-
105
-
106
-
107
-
108
-
109
-
110
-
111
-
112
-
113
-
114
-
115
-
116
-
117
-
118
-
119
-
120
-
121
-
122
-
123
-
124
-
125
-
126
-
127
-
128
-
129
-
130
-
131
-
132
-
133
-
134
-
135
-
136
-
137
-
138
-
139
-
140
-
141
-
142
-
143
-
144
-
145
-
146
-
147
-
148
-
149
-
150
-
151
-
152
-
153
-
154
-
155
-
156
-
157
-
158
-
159
-
160
-
 161
161 -
 162
162 -
 163
163 -
 164
164 -
 165
165 -
 166
166 -
 167
167 -
 168
168 -
 169
169 -
 170
170 -
 171
171 -
 172
172 -
 173
173 -
 174
174 -
 175
175 -
 176
176 -
 177
177 -
 178
178 -
 179
179 -
 180
180 -
 181
181 -
182
-
183
-
184
-
185
-
186
-
187
-
188
-
189
-
190
-
191
-
192
-
193
-
194
-
195
-
196
-
197
-
198
-
199
-
200
-
201
-
202
-
203
-
204
-
205
-
206
-
207
-
208
-
209
-
210
-
211
-
212
-
213
-
214
-
215
-
216
-
217
-
218
-
219
-
220
 |
 |

10-K
DOLLAR GENERAL CORPORATION AND SUBSIDIARIES
NOTES TO CONSOLIDATED FINANCIAL STATEMENTS (Continued)
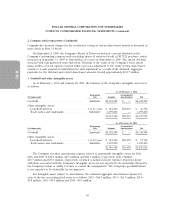
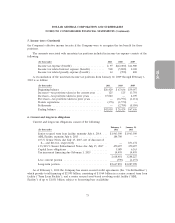
5. Income taxes (Continued)
tax expense, income tax related interest expense and other expense items. The 2010 effective resolution
of various examinations by the taxing authorities, when combined with unfavorable examination results
in 2009, resulted in a decrease in the year-to-year state income tax expense rate (net of federal income
tax expense) of approximately 1.8%. This decrease in state income tax expense was partially offset by
an increase in state income tax expense due to a shift in income to companies within the group that
have a higher effective state income tax rate. In addition, income tax related interest accruals and
income tax related penalty accruals (with the penalty accruals being included in Other, net) were also
reduced due to favorable income tax examination results, thereby resulting in a decrease in income tax
related interest expense and a decrease in Other income tax expense. Additional decreases in Other,
net items occurred due to favorable outcomes in 2010 associated with the completion of a federal
income tax examination and reductions in expense associated with uncertain tax benefit accruals.
The 2009 effective tax rate was an expense of 38.5%. This expense was greater than the expected
tax rate of 35% due primarily to the inclusion of state income taxes in the total effective tax rate.
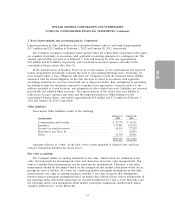
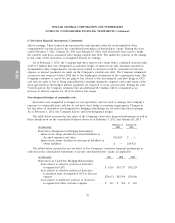
Deferred taxes reflect the effects of temporary differences between carrying amounts of assets and
liabilities for financial reporting purposes and the amounts used for income tax purposes. Significant
components of the Company’s deferred tax assets and liabilities are as follows:
February 3, January 28,
(In thousands) 2012 2011
Deferred tax assets:
Deferred compensation expense .......................... $ 7,851 $ 6,653
Accrued expenses and other ............................. 6,735 4,798
Accrued rent ........................................ 11,125 8,581
Accrued insurance .................................... 70,180 67,634
Accrued bonuses ..................................... 16,686 20,116
Interest rate hedges ................................... 4,479 13,650
Tax benefit of income tax and interest reserves related to uncertain
tax positions ....................................... 2,690 2,520
Other ............................................. 16,010 16,321
State tax net operating loss carryforwards, net of federal tax ...... 33 4,697
State tax credit carryforwards, net of federal tax ............... 10,628 12,511
146,417 157,481
Less valuation allowances ................................. (4,881) (7,083)
Total deferred tax assets .................................. 141,536 150,398
Deferred tax liabilities:
Property and equipment ................................ (287,447) (222,757)
Inventories .......................................... (49,345) (68,314)
Trademarks ......................................... (435,611) (435,543)
Amortizable assets .................................... (13,234) (21,288)
Insurance related tax method change ....................... — (14,844)
Bonus related tax method change ......................... (13,078) (19,520)
Other ............................................. (3,539) (3,551)
Total deferred tax liabilities ............................... (802,254) (785,817)
Net deferred tax liabilities ................................ $(660,718) $(635,419)
71