Dollar General 2011 Annual Report Download - page 157
Download and view the complete annual report
Please find page 157 of the 2011 Dollar General annual report below. You can navigate through the pages in the report by either clicking on the pages listed below, or by using the keyword search tool below to find specific information within the annual report.-
 1
1 -
2
-
3
-
4
-
5
-
6
-
7
-
8
-
9
-
10
-
11
-
12
-
13
-
14
-
15
-
16
-
17
-
18
-
19
-
20
-
21
-
22
-
23
-
24
-
25
-
26
-
27
-
28
-
29
-
30
-
31
-
32
-
33
-
34
-
35
-
36
-
37
-
38
-
39
-
40
-
41
-
42
-
43
-
44
-
45
-
46
-
47
-
48
-
49
-
50
-
51
-
52
-
53
-
54
-
55
-
56
-
57
-
58
-
59
-
60
-
61
-
62
-
63
-
64
-
65
-
66
-
67
-
68
-
69
-
70
-
71
-
72
-
73
-
74
-
75
-
76
-
77
-
78
-
79
-
80
-
81
-
82
-
83
-
84
-
85
-
86
-
87
-
88
-
89
-
90
-
91
-
92
-
93
-
94
-
95
-
96
-
97
-
98
-
99
-
100
-
101
-
102
-
103
-
104
-
105
-
106
-
107
-
108
-
109
-
110
-
111
-
112
-
113
-
114
-
115
-
116
-
117
-
118
-
119
-
120
-
121
-
122
-
123
-
124
-
125
-
126
-
127
-
128
-
129
-
130
-
131
-
132
-
133
-
134
-
135
-
136
-
137
-
138
-
139
-
140
-
141
-
142
-
143
-
144
-
145
-
146
-
 147
147 -
 148
148 -
 149
149 -
 150
150 -
 151
151 -
 152
152 -
 153
153 -
 154
154 -
 155
155 -
 156
156 -
 157
157 -
 158
158 -
 159
159 -
 160
160 -
 161
161 -
 162
162 -
 163
163 -
 164
164 -
 165
165 -
 166
166 -
 167
167 -
168
-
169
-
170
-
171
-
172
-
173
-
174
-
175
-
176
-
177
-
178
-
179
-
180
-
181
-
182
-
183
-
184
-
185
-
186
-
187
-
188
-
189
-
190
-
191
-
192
-
193
-
194
-
195
-
196
-
197
-
198
-
199
-
200
-
201
-
202
-
203
-
204
-
205
-
206
-
207
-
208
-
209
-
210
-
211
-
212
-
213
-
214
-
215
-
216
-
217
-
218
-
219
-
220
 |
 |

10-K
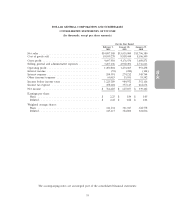
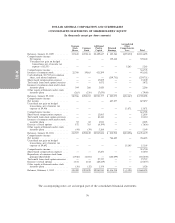
DOLLAR GENERAL CORPORATION AND SUBSIDIARIES
CONSOLIDATED STATEMENTS OF CASH FLOWS
(In thousands)
For the Year Ended
February 3, January 28, January 29,
2012 2011 2010
Cash flows from operating activities:
Net income ............................................ $ 766,685 $ 627,857 $ 339,442
Adjustments to reconcile net income to net cash provided by operating
activities:
Depreciation and amortization ............................. 275,408 254,927 256,771
Deferred income taxes ................................... 10,232 50,985 14,860
Tax benefit of stock options ............................... (33,102) (13,905) (5,390)
Loss on debt retirement, net .............................. 60,303 14,576 55,265
Noncash share-based compensation .......................... 15,250 15,956 17,295
Noncash inventory adjustments and asset impairments ............. 48,673 7,607 647
Other noncash gains and losses ............................. 5,517 5,942 7,920
Change in operating assets and liabilities:
Merchandise inventories ................................ (291,492) (251,809) (100,248)
Prepaid expenses and other current assets .................... (34,554) (10,157) (7,298)
Accounts payable ..................................... 104,442 123,424 106,049
Accrued expenses and other liabilities ....................... 71,763 (42,428) (12,643)
Income taxes ....................................... 51,550 42,903 1,153
Other ............................................ (195) (1,194) (1,000)
Net cash provided by operating activities ........................ 1,050,480 824,684 672,823
Cash flows from investing activities:
Purchases of property and equipment .......................... (514,861) (420,395) (250,747)
Proceeds from sales of property and equipment ................... 1,026 1,448 2,701
Net cash used in investing activities ........................... (513,835) (418,947) (248,046)
Cash flows from financing activities:
Issuance of common stock .................................. 177 631 443,753
Repayments of long-term obligations .......................... (911,951) (131,180) (784,180)
Borrowings under revolving credit facility ....................... 1,157,800 — —
Repayments of borrowings under revolving credit facility ............. (973,100) — —
Repurchase of common stock from principal shareholder ............. (185,000) — —
Payment of cash dividends and related amounts ................... — — (239,731)
Equity settlements with employees, net of taxes paid ................ (28,993) (13,723) (5,928)
Tax benefit of stock options ................................. 33,102 13,905 5,390
Net cash used in financing activities ........................... (907,965) (130,367) (580,696)
Net increase (decrease) in cash and cash equivalents ................ (371,320) 275,370 (155,919)
Cash and cash equivalents, beginning of year ..................... 497,446 222,076 377,995
Cash and cash equivalents, end of year ......................... $ 126,126 $ 497,446 $ 222,076
Supplemental cash flow information:
Cash paid for:
Interest ............................................. $ 209,351 $ 244,752 $ 328,433
Income taxes ......................................... 382,294 314,123 187,983
Supplemental schedule of noncash investing and financing activities:
Purchases of property and equipment awaiting processing for payment,
included in Accounts payable .............................. $ 35,662 $ 29,658 $ 30,393
The accompanying notes are an integral part of the consolidated financial statements.
57