Dollar General 2011 Annual Report Download - page 176
Download and view the complete annual report
Please find page 176 of the 2011 Dollar General annual report below. You can navigate through the pages in the report by either clicking on the pages listed below, or by using the keyword search tool below to find specific information within the annual report.-
 1
1 -
2
-
3
-
4
-
5
-
6
-
7
-
8
-
9
-
10
-
11
-
12
-
13
-
14
-
15
-
16
-
17
-
18
-
19
-
20
-
21
-
22
-
23
-
24
-
25
-
26
-
27
-
28
-
29
-
30
-
31
-
32
-
33
-
34
-
35
-
36
-
37
-
38
-
39
-
40
-
41
-
42
-
43
-
44
-
45
-
46
-
47
-
48
-
49
-
50
-
51
-
52
-
53
-
54
-
55
-
56
-
57
-
58
-
59
-
60
-
61
-
62
-
63
-
64
-
65
-
66
-
67
-
68
-
69
-
70
-
71
-
72
-
73
-
74
-
75
-
76
-
77
-
78
-
79
-
80
-
81
-
82
-
83
-
84
-
85
-
86
-
87
-
88
-
89
-
90
-
91
-
92
-
93
-
94
-
95
-
96
-
97
-
98
-
99
-
100
-
101
-
102
-
103
-
104
-
105
-
106
-
107
-
108
-
109
-
110
-
111
-
112
-
113
-
114
-
115
-
116
-
117
-
118
-
119
-
120
-
121
-
122
-
123
-
124
-
125
-
126
-
127
-
128
-
129
-
130
-
131
-
132
-
133
-
134
-
135
-
136
-
137
-
138
-
139
-
140
-
141
-
142
-
143
-
144
-
145
-
146
-
147
-
148
-
149
-
150
-
151
-
152
-
153
-
154
-
155
-
156
-
157
-
158
-
159
-
160
-
161
-
162
-
163
-
164
-
165
-
 166
166 -
 167
167 -
 168
168 -
 169
169 -
 170
170 -
 171
171 -
 172
172 -
 173
173 -
 174
174 -
 175
175 -
 176
176 -
 177
177 -
 178
178 -
 179
179 -
 180
180 -
 181
181 -
 182
182 -
 183
183 -
 184
184 -
 185
185 -
 186
186 -
187
-
188
-
189
-
190
-
191
-
192
-
193
-
194
-
195
-
196
-
197
-
198
-
199
-
200
-
201
-
202
-
203
-
204
-
205
-
206
-
207
-
208
-
209
-
210
-
211
-
212
-
213
-
214
-
215
-
216
-
217
-
218
-
219
-
220
 |
 |

10-K
DOLLAR GENERAL CORPORATION AND SUBSIDIARIES
NOTES TO CONSOLIDATED FINANCIAL STATEMENTS (Continued)
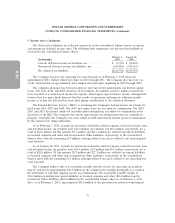
6. Current and long-term obligations (Continued)
Subordinated Notes at redemption prices of 110.625% and 111.875%, respectively, plus accrued and
unpaid interest, resulting in pretax losses of $24.9 million and $25.7 million, respectively.
Interest on the Senior Subordinated Notes is payable on January 15 and July 15 of each year. Cash
interest on the Senior Subordinated Notes accrues at a rate of 11.875% per annum. An option to elect
to pay interest by increasing the principal amount of the Senior Subordinated Notes or issuing new
Senior Subordinated Notes (‘‘PIK interest’’) instead of paying cash interest expired in 2011. As a result,
all interest on the Senior Subordinated Notes has been paid or will be payable in cash.
The Senior Subordinated Notes are fully and unconditionally guaranteed by each of the existing
and future direct or indirect wholly owned domestic subsidiaries that guarantee the obligations under
the Company’s Credit Facilities.
The Company may redeem some or all of the Senior Subordinated Notes at any time at
redemption prices described or set forth in the senior subordinated indenture. In addition, the holders
of the Senior Subordinated Notes can require the Company to redeem the Senior Subordinated Notes
at 101% of the aggregate principal amount outstanding in the event of certain change in control events.
The senior subordinated indenture contains certain covenants, including, among other things,
covenants that limit the Company’s ability to incur additional indebtedness, create liens, sell assets,
enter into transactions with affiliates, or consolidate or dispose of all of its assets.
Scheduled debt maturities, including capital lease obligations, for the Company’s fiscal years listed
below are as follows (in thousands): 2012—$590; 2013—$184,992; 2014—$1,963,815; 2015—$454;
2016—$618; thereafter—$468,012.
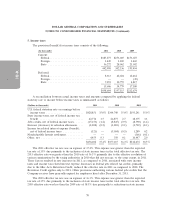
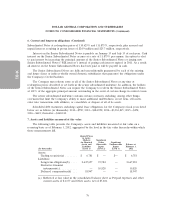
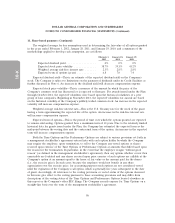
7. Assets and liabilities measured at fair value
The following table presents the Company’s assets and liabilities measured at fair value on a
recurring basis as of February 3, 2012, aggregated by the level in the fair value hierarchy within which
those measurements fall.
Quoted Prices
in Active
Markets Significant
for Identical Other Significant
Assets and Observable Unobservable Balance at
Liabilities Inputs Inputs February 3,
(In thousands) (Level 1) (Level 2) (Level 3) 2012
Assets:
Trading securities(a) ........ $ 6,781 $ — $— $ 6,781
Liabilities:
Long-term obligations(b) .... 2,647,697 19,584 — 2,667,281
Derivative financial
instruments(c) ........... — 10,820 — 10,820
Deferred compensation(d) . . . 18,947 — — 18,947
(a) Reflected at fair value in the consolidated balance sheet as Prepaid expenses and other
current assets of $1,377 and Other assets, net of $5,404.
76