Dollar General 2011 Annual Report Download - page 141
Download and view the complete annual report
Please find page 141 of the 2011 Dollar General annual report below. You can navigate through the pages in the report by either clicking on the pages listed below, or by using the keyword search tool below to find specific information within the annual report.-
 1
1 -
2
-
3
-
4
-
5
-
6
-
7
-
8
-
9
-
10
-
11
-
12
-
13
-
14
-
15
-
16
-
17
-
18
-
19
-
20
-
21
-
22
-
23
-
24
-
25
-
26
-
27
-
28
-
29
-
30
-
31
-
32
-
33
-
34
-
35
-
36
-
37
-
38
-
39
-
40
-
41
-
42
-
43
-
44
-
45
-
46
-
47
-
48
-
49
-
50
-
51
-
52
-
53
-
54
-
55
-
56
-
57
-
58
-
59
-
60
-
61
-
62
-
63
-
64
-
65
-
66
-
67
-
68
-
69
-
70
-
71
-
72
-
73
-
74
-
75
-
76
-
77
-
78
-
79
-
80
-
81
-
82
-
83
-
84
-
85
-
86
-
87
-
88
-
89
-
90
-
91
-
92
-
93
-
94
-
95
-
96
-
97
-
98
-
99
-
100
-
101
-
102
-
103
-
104
-
105
-
106
-
107
-
108
-
109
-
110
-
111
-
112
-
113
-
114
-
115
-
116
-
117
-
118
-
119
-
120
-
121
-
122
-
123
-
124
-
125
-
126
-
127
-
128
-
129
-
130
-
 131
131 -
 132
132 -
 133
133 -
 134
134 -
 135
135 -
 136
136 -
 137
137 -
 138
138 -
 139
139 -
 140
140 -
 141
141 -
 142
142 -
 143
143 -
 144
144 -
 145
145 -
 146
146 -
 147
147 -
 148
148 -
 149
149 -
 150
150 -
 151
151 -
152
-
153
-
154
-
155
-
156
-
157
-
158
-
159
-
160
-
161
-
162
-
163
-
164
-
165
-
166
-
167
-
168
-
169
-
170
-
171
-
172
-
173
-
174
-
175
-
176
-
177
-
178
-
179
-
180
-
181
-
182
-
183
-
184
-
185
-
186
-
187
-
188
-
189
-
190
-
191
-
192
-
193
-
194
-
195
-
196
-
197
-
198
-
199
-
200
-
201
-
202
-
203
-
204
-
205
-
206
-
207
-
208
-
209
-
210
-
211
-
212
-
213
-
214
-
215
-
216
-
217
-
218
-
219
-
220
 |
 |

10-K
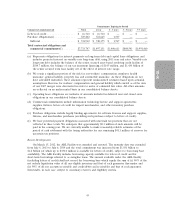
U.S. GAAP. Because not all companies use identical calculations, these presentations of EBITDA and
Adjusted EBITDA may not be comparable to other similarly titled measures of other companies. We
believe that the presentation of EBITDA and Adjusted EBITDA is appropriate to provide additional
information about the calculation of this financial ratio in the Credit Facilities. Adjusted EBITDA is a
material component of this ratio. Specifically, non-compliance with the senior secured indebtedness
ratio contained in our Credit Facilities could prohibit us from making investments, incurring liens,
making certain restricted payments and incurring additional secured indebtedness (other than the
additional funding provided for under the senior secured credit agreement and pursuant to specified
exceptions).
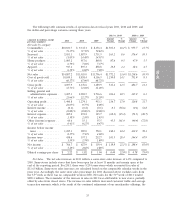
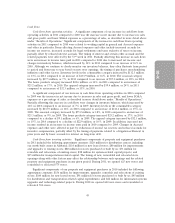
The calculation of Adjusted EBITDA under the Credit Facilities is as follows:
Year Ended
February 3, January 28,
2012 2011
(in millions)
Net income .................................... $ 766.7 $ 627.9
Add (subtract):
Interest income ................................ (0.1) (0.2)
Interest expense ............................... 205.0 274.1
Depreciation and amortization ..................... 264.1 242.3
Income taxes .................................. 458.6 357.1
EBITDA ...................................... 1,694.3 1,501.2
Adjustments:
Loss on debt retirements ......................... 60.3 14.6
Loss on hedging instruments ...................... 0.4 0.4
Advisory and consulting fees to affiliates .............. — 0.1
Non-cash expense for share-based awards ............. 15.3 16.0
Litigation settlement and related costs, net ............ 13.1 —
Indirect merger-related costs ...................... 0.9 1.3
Other non-cash charges (including LIFO) ............. 53.3 11.5
Total Adjustments ................................ 143.3 43.9
Adjusted EBITDA ............................... $1,837.6 $1,545.1
Interest Rate Swaps
We use interest rate swaps to minimize the risk of adverse changes in interest rates. These swaps
are intended to reduce risk by hedging an underlying economic exposure. Because of high correlation
between the derivative financial instrument and the underlying exposure being hedged, fluctuations in
the value of the financial instruments are generally offset by reciprocal changes in the value of the
underlying economic exposure. Our principal interest rate exposure relates to outstanding amounts
under our Credit Facilities. At February 3, 2012, we had interest rate swaps with a total notional
amount of approximately $533.3 million. For more information see Item 7A ‘‘Quantitative and
Qualitative Disclosures about Market Risk’’ below.
Fair Value Accounting
We have classified our interest rate swaps, as further discussed in Item 7A. below, in Level 2 of
the fair value hierarchy, as the significant inputs to the overall valuations are based on market-
observable data or information derived from or corroborated by market-observable data, including
market-based inputs to models, model calibration to market-clearing transactions, broker or dealer
quotations, or alternative pricing sources with reasonable levels of price transparency. Where models
41