Dollar General 2011 Annual Report Download - page 130
Download and view the complete annual report
Please find page 130 of the 2011 Dollar General annual report below. You can navigate through the pages in the report by either clicking on the pages listed below, or by using the keyword search tool below to find specific information within the annual report.-
 1
1 -
2
-
3
-
4
-
5
-
6
-
7
-
8
-
9
-
10
-
11
-
12
-
13
-
14
-
15
-
16
-
17
-
18
-
19
-
20
-
21
-
22
-
23
-
24
-
25
-
26
-
27
-
28
-
29
-
30
-
31
-
32
-
33
-
34
-
35
-
36
-
37
-
38
-
39
-
40
-
41
-
42
-
43
-
44
-
45
-
46
-
47
-
48
-
49
-
50
-
51
-
52
-
53
-
54
-
55
-
56
-
57
-
58
-
59
-
60
-
61
-
62
-
63
-
64
-
65
-
66
-
67
-
68
-
69
-
70
-
71
-
72
-
73
-
74
-
75
-
76
-
77
-
78
-
79
-
80
-
81
-
82
-
83
-
84
-
85
-
86
-
87
-
88
-
89
-
90
-
91
-
92
-
93
-
94
-
95
-
96
-
97
-
98
-
99
-
100
-
101
-
102
-
103
-
104
-
105
-
106
-
107
-
108
-
109
-
110
-
111
-
112
-
113
-
114
-
115
-
116
-
117
-
118
-
119
-
 120
120 -
 121
121 -
 122
122 -
 123
123 -
 124
124 -
 125
125 -
 126
126 -
 127
127 -
 128
128 -
 129
129 -
 130
130 -
 131
131 -
 132
132 -
 133
133 -
 134
134 -
 135
135 -
 136
136 -
 137
137 -
 138
138 -
 139
139 -
 140
140 -
141
-
142
-
143
-
144
-
145
-
146
-
147
-
148
-
149
-
150
-
151
-
152
-
153
-
154
-
155
-
156
-
157
-
158
-
159
-
160
-
161
-
162
-
163
-
164
-
165
-
166
-
167
-
168
-
169
-
170
-
171
-
172
-
173
-
174
-
175
-
176
-
177
-
178
-
179
-
180
-
181
-
182
-
183
-
184
-
185
-
186
-
187
-
188
-
189
-
190
-
191
-
192
-
193
-
194
-
195
-
196
-
197
-
198
-
199
-
200
-
201
-
202
-
203
-
204
-
205
-
206
-
207
-
208
-
209
-
210
-
211
-
212
-
213
-
214
-
215
-
216
-
217
-
218
-
219
-
220
 |
 |

10-K
and overall customer experience. We effectively implemented a new workforce management system
resulting in significant cost savings as a percentage of sales. We also further implemented an energy
management system in the stores. As part of our efforts to continue to increase productivity, we
installed faster data transmission technology in our stores and believe that going forward, we will have
additional opportunities to leverage this investment and our other information technology resources to
create greater efficiencies in our retail store operations.
Our fourth priority is to strengthen and expand Dollar General’s culture of serving others. For
customers this means helping them ‘‘Save time. Save money. Every day!’’ by providing clean,
well-stocked stores with quality products at low prices. For employees, this means creating an
environment that attracts and retains key employees throughout the organization. For the public, this
means giving back to our store communities through our charitable and other efforts. In 2011, we
donated approximately $2.4 million through our corporate charitable giving program. For shareholders,
this means meeting their expectations of an efficiently and profitably run organization that operates
with compassion and integrity.
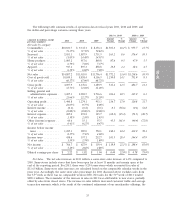
Our continued focus on these four priorities resulted in improved 2011 financial performance over
the prior year as follows. Note that fiscal 2011 consisted of 53 weeks while fiscal 2010 consisted of
52 weeks. Basis points, as referred to below, are equal to 0.01 percent of total sales.
• Total sales in 2011 (53 weeks) increased 13.6% over 2010. Sales in same-stores increased 6.0%,
with increases in both customer traffic and average transaction amount. Consumables, most
notably food, drove 85% of the total increase in sales. Average sales per square foot in 2011
were $213 (including a $4 contribution from the 53rd week), up from $201 in 2010.
• Operating profit increased 17.0% to $1.49 billion, or 10.1% of sales, compared to $1.27 billion,
or 9.8% of sales in 2010. The improvement in our operating profit rate was attributable to a
61 basis-point reduction of SG&A offset by a 31 basis-point contraction of our gross profit rate.
• The improvement in SG&A, as a percentage of sales, was due in large part to increased sales
(including the 53rd week) and improved utilization of store labor. For other factors, see the
detailed discussion that follows.
• We are pleased with our ability to manage our gross profit rate in a period of significant
commodity cost increases and related LIFO charges, high fuel costs and limited discretionary
spending by our core customers. Our gross profit rate was also affected by numerous factors
including a decrease in our mix of non-consumables and higher markdowns.
• Interest expense decreased by $69 million in 2011 to $205 million, primarily as the result of
lower average outstanding long-term obligations. In 2011, we repurchased the remaining balance
of our 10.625% senior notes, resulting in a non-operating charge of $60 million. Total long-term
obligations of $2.62 billion as of February 3, 2012 were $670 million less than in the prior year.
• We reported net income of $767 million, or $2.22 per diluted share, for fiscal 2011, compared to
net income of $628 million, or $1.82 per diluted share, for fiscal 2010.
• We generated approximately $1.05 billion of cash flows from operating activities in 2011, an
increase of over 27 percent compared to 2010. Cash flow was primarily utilized to support our
capital expenditures, repurchase long-term obligations, and repurchase our common stock.
• During 2011, we opened 625 new stores, remodeled or relocated 575 stores, and closed
60 stores. Included in these totals are 12 new and 25 remodeled Dollar General Market stores.
As discussed in more detail below, in recent years, we have generated significant cash flows from
operating activities. We have used a portion of these cash flows to pay down debt and to invest in new
store growth through our traditional leased stores. In the second half of 2010 we made a strategic
30