Dollar General 2011 Annual Report Download - page 145
Download and view the complete annual report
Please find page 145 of the 2011 Dollar General annual report below. You can navigate through the pages in the report by either clicking on the pages listed below, or by using the keyword search tool below to find specific information within the annual report.-
 1
1 -
2
-
3
-
4
-
5
-
6
-
7
-
8
-
9
-
10
-
11
-
12
-
13
-
14
-
15
-
16
-
17
-
18
-
19
-
20
-
21
-
22
-
23
-
24
-
25
-
26
-
27
-
28
-
29
-
30
-
31
-
32
-
33
-
34
-
35
-
36
-
37
-
38
-
39
-
40
-
41
-
42
-
43
-
44
-
45
-
46
-
47
-
48
-
49
-
50
-
51
-
52
-
53
-
54
-
55
-
56
-
57
-
58
-
59
-
60
-
61
-
62
-
63
-
64
-
65
-
66
-
67
-
68
-
69
-
70
-
71
-
72
-
73
-
74
-
75
-
76
-
77
-
78
-
79
-
80
-
81
-
82
-
83
-
84
-
85
-
86
-
87
-
88
-
89
-
90
-
91
-
92
-
93
-
94
-
95
-
96
-
97
-
98
-
99
-
100
-
101
-
102
-
103
-
104
-
105
-
106
-
107
-
108
-
109
-
110
-
111
-
112
-
113
-
114
-
115
-
116
-
117
-
118
-
119
-
120
-
121
-
122
-
123
-
124
-
125
-
126
-
127
-
128
-
129
-
130
-
131
-
132
-
133
-
134
-
 135
135 -
 136
136 -
 137
137 -
 138
138 -
 139
139 -
 140
140 -
 141
141 -
 142
142 -
 143
143 -
 144
144 -
 145
145 -
 146
146 -
 147
147 -
 148
148 -
 149
149 -
 150
150 -
 151
151 -
 152
152 -
 153
153 -
 154
154 -
 155
155 -
156
-
157
-
158
-
159
-
160
-
161
-
162
-
163
-
164
-
165
-
166
-
167
-
168
-
169
-
170
-
171
-
172
-
173
-
174
-
175
-
176
-
177
-
178
-
179
-
180
-
181
-
182
-
183
-
184
-
185
-
186
-
187
-
188
-
189
-
190
-
191
-
192
-
193
-
194
-
195
-
196
-
197
-
198
-
199
-
200
-
201
-
202
-
203
-
204
-
205
-
206
-
207
-
208
-
209
-
210
-
211
-
212
-
213
-
214
-
215
-
216
-
217
-
218
-
219
-
220
 |
 |

10-K
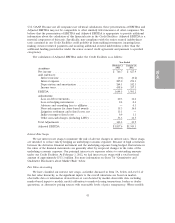
Cash flows
Cash flows from operating activities. A significant component of our increase in cash flows from
operating activities in 2011 compared to 2010 was the increase in net income due to increases in sales
and gross profit, and lower SG&A expenses as a percentage of sales, as described in more detail above
under ‘‘Results of Operations.’’ Significant components of the increase in cash flows from operating
activities in 2011 compared to 2010 were related to working capital in general and Accrued expenses
and other in particular. Items affecting Accrued expenses and other include increased accruals for
income tax reserves, increased accruals for legal settlements and taxes exclusive of taxes on income,
partially offset by reduced interest accruals. The timing of interest and certain other accruals and the
related payments were affected by the 53rd week in 2011. Partially offsetting this increase in cash flows
were an increase in income taxes paid in 2011 compared to 2010 due to increased net income and
changes in inventory balances, which increased by 14% in 2011 compared to an increase of 16% in
2010. Although we continue to closely monitor our inventory balances, they often fluctuate from period
to period and from year to year based on new store openings, the timing of purchases, merchandising
initiatives and other factors. Inventory levels in the consumables category increased by $132.3 million,
or 13%, in 2011 compared to an increase of $133.9 million, or 16%, in 2010. The seasonal category
increased by $27.5 million, or 7%, in 2011 compared to an increase of $55.2 million, or 18%, in 2010.
The home products category increased $24.6 million, or 14%, in 2011 compared to an increase of
$25.2 million, or 17%, in 2010. The apparel category increased by $59.4 million, or 24%, in 2011
compared to an increase of $32.3 million, or 15%, in 2010.
A significant component of our increase in cash flows from operating activities in 2010 compared
to 2009 was the increase in net income due to increases in sales and gross profit, and lower SG&A
expenses as a percentage of sales, as described in more detail above under ‘‘Results of Operations.’’
Partially offsetting this increase in cash flows were changes in inventory balances, which increased by
16% in 2010 compared to an increase of 7% in 2009. Inventory levels in the consumables category
increased by $133.9 million, or 16%, in 2010 compared to an increase of $111.4 million, or 15%, in
2009. The seasonal category increased by $55.2 million, or 18%, in 2010 compared to an increase of
$25.3 million, or 9%, in 2009. The home products category increased $25.2 million, or 17%, in 2010
compared to a decline of $9.1 million, or 6%, in 2009. The apparel category increased by $32.3 million,
or 15%, in 2010 compared to a decline of $22.9 million, or 10%, in 2009. In addition, increased net
income resulted in an increase in income taxes paid in 2010 compared to 2009. Changes in Accrued
expenses and other were affected in part by reductions of income tax reserves and reduced accruals for
incentive compensation, partially offset by the timing of payments related to a litigation settlement in
prior years and by lower accruals for interest on long-term debt.
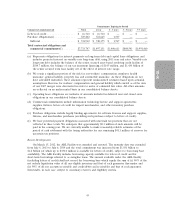
Cash flows from investing activities. Significant components of property and equipment purchases
in 2011 included the following approximate amounts: $120 million for distribution centers, including
our newly built center in Alabama; $114 million for new leased stores; $80 million for improvements
and upgrades to existing stores; $80 million for stores purchased or built by us; $73 million for
remodels and relocations of existing stores; $28 million for systems-related capital projects; and
$15 million for transportation-related capital. The timing of new, remodeled and relocated store
openings along with other factors may affect the relationship between such openings and the related
property and equipment purchases in any given period. During 2011, we opened 625 new stores and
remodeled or relocated 575 stores.
Significant components of our property and equipment purchases in 2010 included the following
approximate amounts: $156 million for improvements, upgrades, remodels and relocations of existing
stores; $100 million for new leased stores; $91 million for stores purchased or built by us; $45 million
for distribution and transportation-related capital expenditures; and $22 million for information systems
upgrades and technology-related projects. During 2010 we opened 600 new stores and remodeled or
relocated 504 stores.
45