Dollar General 2011 Annual Report Download - page 38
Download and view the complete annual report
Please find page 38 of the 2011 Dollar General annual report below. You can navigate through the pages in the report by either clicking on the pages listed below, or by using the keyword search tool below to find specific information within the annual report.-
 1
1 -
2
-
3
-
4
-
5
-
6
-
7
-
8
-
9
-
10
-
11
-
12
-
13
-
14
-
15
-
16
-
17
-
18
-
19
-
20
-
21
-
22
-
23
-
24
-
25
-
26
-
27
-
 28
28 -
 29
29 -
 30
30 -
 31
31 -
 32
32 -
 33
33 -
 34
34 -
 35
35 -
 36
36 -
 37
37 -
 38
38 -
 39
39 -
 40
40 -
 41
41 -
 42
42 -
 43
43 -
 44
44 -
 45
45 -
 46
46 -
 47
47 -
 48
48 -
49
-
50
-
51
-
52
-
53
-
54
-
55
-
56
-
57
-
58
-
59
-
60
-
61
-
62
-
63
-
64
-
65
-
66
-
67
-
68
-
69
-
70
-
71
-
72
-
73
-
74
-
75
-
76
-
77
-
78
-
79
-
80
-
81
-
82
-
83
-
84
-
85
-
86
-
87
-
88
-
89
-
90
-
91
-
92
-
93
-
94
-
95
-
96
-
97
-
98
-
99
-
100
-
101
-
102
-
103
-
104
-
105
-
106
-
107
-
108
-
109
-
110
-
111
-
112
-
113
-
114
-
115
-
116
-
117
-
118
-
119
-
120
-
121
-
122
-
123
-
124
-
125
-
126
-
127
-
128
-
129
-
130
-
131
-
132
-
133
-
134
-
135
-
136
-
137
-
138
-
139
-
140
-
141
-
142
-
143
-
144
-
145
-
146
-
147
-
148
-
149
-
150
-
151
-
152
-
153
-
154
-
155
-
156
-
157
-
158
-
159
-
160
-
161
-
162
-
163
-
164
-
165
-
166
-
167
-
168
-
169
-
170
-
171
-
172
-
173
-
174
-
175
-
176
-
177
-
178
-
179
-
180
-
181
-
182
-
183
-
184
-
185
-
186
-
187
-
188
-
189
-
190
-
191
-
192
-
193
-
194
-
195
-
196
-
197
-
198
-
199
-
200
-
201
-
202
-
203
-
204
-
205
-
206
-
207
-
208
-
209
-
210
-
211
-
212
-
213
-
214
-
215
-
216
-
217
-
218
-
219
-
220
 |
 |

Proxy
objective. The Committee considered that level to be challenging and more difficult to achieve than
performance targets for prior years, requiring superior execution and success on many of our new
business initiatives. As it has done since 2008, the Committee also established the adjusted EBITDA
threshold at 95% of target.
The Committee established the target adjusted ROIC performance level for the 2011
Teamshare program at 21.9% which was the same level as our 2011 annual financial plan objective.
Again, the Committee viewed the target as challenging to achieve The threshold adjusted ROIC
performance level was set at 21.83%, or 7 basis points lower than the target level, and the 200%
achievement level was set at 22.83%, or 100 basis points higher than the threshold level.
The bonus payable to each named executive officer if we reached the 2011 target performance
levels for each of the financial performance measures is equal to the applicable percentage of salary as
set forth in the chart below. For all named executive officers other than Mr. Dreiling, such percentages
are consistent with those for prior years and continued to fall within the median of the payout
percentages for the market comparator group. As discussed under ‘‘Base Salary’’ above, in order to
more closely align Mr. Dreiling’s bonus target and total cash compensation with the median of the
market comparator group, the Committee increased Mr. Dreiling’s 2011 bonus target from 125% of his
base salary to 130%.
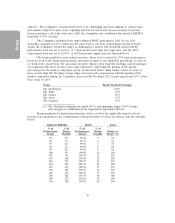
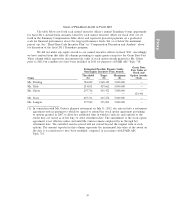
Name Target Payout Percentage
Mr. Dreiling(1) 130%
Mr. Tehle 65%
Ms. Guion 65%
Mr. Vasos 65%
Ms. Lanigan 65%
(1) Mr. Dreiling’s minimum threshold (50%) and minimum target (125%) bonus
percentages are established in his employment agreement with us.
Bonus payments for financial performance below or above the applicable target levels are
prorated on a graduated scale commensurate with performance levels in accordance with the schedule
below:
Adjusted EBITDA ROIC Total
% of % of % of % of
Performance Bonus Performance Bonus Bonus at
Target Payable Target Payable Target (%)
95 45 99.68 5 50
96 54 99.74 6 60
97 63 99.81 7 70
98 72 99.87 8 80
99 81 99.94 9 90
100 90 100.00 10 100
101 99 100.42 11 110
102 108 100.85 12 120
103 117 101.27 13 130
104 126 101.70 14 140
105 135 102.12 15 150
106 144 102.55 16 160
107 153 102.97 17 170
108 162 103.40 18 180
109 171 103.82 19 190
110 180 104.25 20 200
30