Dollar General 2011 Annual Report Download - page 137
Download and view the complete annual report
Please find page 137 of the 2011 Dollar General annual report below. You can navigate through the pages in the report by either clicking on the pages listed below, or by using the keyword search tool below to find specific information within the annual report.-
 1
1 -
2
-
3
-
4
-
5
-
6
-
7
-
8
-
9
-
10
-
11
-
12
-
13
-
14
-
15
-
16
-
17
-
18
-
19
-
20
-
21
-
22
-
23
-
24
-
25
-
26
-
27
-
28
-
29
-
30
-
31
-
32
-
33
-
34
-
35
-
36
-
37
-
38
-
39
-
40
-
41
-
42
-
43
-
44
-
45
-
46
-
47
-
48
-
49
-
50
-
51
-
52
-
53
-
54
-
55
-
56
-
57
-
58
-
59
-
60
-
61
-
62
-
63
-
64
-
65
-
66
-
67
-
68
-
69
-
70
-
71
-
72
-
73
-
74
-
75
-
76
-
77
-
78
-
79
-
80
-
81
-
82
-
83
-
84
-
85
-
86
-
87
-
88
-
89
-
90
-
91
-
92
-
93
-
94
-
95
-
96
-
97
-
98
-
99
-
100
-
101
-
102
-
103
-
104
-
105
-
106
-
107
-
108
-
109
-
110
-
111
-
112
-
113
-
114
-
115
-
116
-
117
-
118
-
119
-
120
-
121
-
122
-
123
-
124
-
125
-
126
-
 127
127 -
 128
128 -
 129
129 -
 130
130 -
 131
131 -
 132
132 -
 133
133 -
 134
134 -
 135
135 -
 136
136 -
 137
137 -
 138
138 -
 139
139 -
 140
140 -
 141
141 -
 142
142 -
 143
143 -
 144
144 -
 145
145 -
 146
146 -
 147
147 -
148
-
149
-
150
-
151
-
152
-
153
-
154
-
155
-
156
-
157
-
158
-
159
-
160
-
161
-
162
-
163
-
164
-
165
-
166
-
167
-
168
-
169
-
170
-
171
-
172
-
173
-
174
-
175
-
176
-
177
-
178
-
179
-
180
-
181
-
182
-
183
-
184
-
185
-
186
-
187
-
188
-
189
-
190
-
191
-
192
-
193
-
194
-
195
-
196
-
197
-
198
-
199
-
200
-
201
-
202
-
203
-
204
-
205
-
206
-
207
-
208
-
209
-
210
-
211
-
212
-
213
-
214
-
215
-
216
-
217
-
218
-
219
-
220
 |
 |

10-K
Liquidity and Capital Resources
Current Financial Condition
During the past three years, we have generated an aggregate of approximately $2.55 billion in cash
flows from operating activities. During that period, we expanded the number of stores we operate by
1,575, or approximately 19%, remodeled or relocated 1,529 stores, or approximately 15% of stores we
operated as of February 3, 2012, and incurred approximately $1.19 billion in capital expenditures. We
made certain strategic decisions which slowed our store growth for a period prior to 2009, but we
reaccelerated store growth beginning in 2009 and currently plan to continue that strategy in 2012 and
for the foreseeable future.
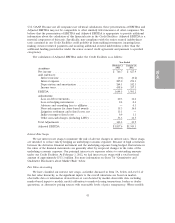
At February 3, 2012, we had total outstanding debt (including the current portion of long-term
obligations) of $2.62 billion, which includes our senior secured asset-based revolving credit facility
(‘‘ABL Facility’’ and, together with the Term Loan Facility, the ‘‘Credit Facilities’’), and senior
subordinated notes, all of which are described in greater detail below. We had $807.9 million available
for borrowing under the ABL Facility at February 3, 2012. Our liquidity needs are significant, primarily
due to our debt service and other obligations. Our substantial debt could adversely affect our ability to
raise additional capital to fund our operations, limit our ability to react to changes in the economy or
our industry or to pursue our growth strategy, expose us to interest rate risk to the extent of our
variable rate debt, and increase the difficulty of our ability to make payments on our outstanding debt
securities.
We believe our cash flow from operations and existing cash balances, combined with availability
under the Credit Facilities (described in greater detail below), will provide sufficient liquidity to fund
our current obligations, projected working capital requirements and capital spending for a period that
includes the next twelve months as well as the next several years.
The ABL Facility was amended and restated on March 15, 2012 as discussed below under ‘‘Recent
Developments.’’
Credit Facilities
Overview. The Credit Facilities consist of the $1.964 billion Term Loan Facility and the ABL
Facility which was recently amended to a maximum of $1.2 billion (of which up to $350.0 million is
available for letters of credit), subject to borrowing base availability. The ABL Facility includes
borrowing capacity available for letters of credit and for short-term borrowings referred to as swingline
loans.
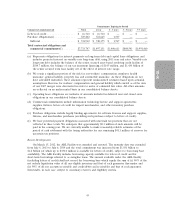
Interest Rates and Fees. Borrowings under the Credit Facilities bear interest at a rate equal to an
applicable margin plus, at our option, either (a) LIBOR or (b) a base rate (which is usually equal to
the prime rate). The applicable margin for borrowings under the Term Loan Facility is 2.75% for
LIBOR borrowings and 1.75% for base-rate borrowings. The interest rate for borrowings under the
Term Loan Facility was 3.1% (without giving effect to the market rate swaps discussed below) as of
February 3, 2012.
The current interest rate for the amended ABL Facility is described below under ‘‘Recent
Developments.’’ As of February 3, 2012, the applicable margin for borrowings under the ABL Facility
(except for the last out tranche) was 1.50% for LIBOR borrowings and 0.50% for base-rate borrowings,
the applicable margin for the last out borrowings was 2.25% for LIBOR borrowings and 1.25% for
base-rate borrowings and the commitment fee to the lenders for any unutilized commitments was
0.375% per annum. See Item 7A. ‘‘Quantitative and Qualitative Disclosures About Market Risk’’ below
for a discussion of our use of interest rate swaps to manage our interest rate risk.
37